
Here Are Goldman’s Top Trades And Themes For 2020
It’s that time of the year when every Wall Street bank publishes its year ahead forecast, and few are as anticipated as that of Goldman Sachs (if mostly for sentimental reasons from when Goldman, which for decades was the most influential and imposing prop desk on Wall Street instead of competing for the subprime dollar with an Apple co-branded credit card as a newly reborn retail bank, moved markets with its predictions).

So without further ado, and starting at the top, two days ago, in his Global Economics report, Goldman’s chief economist Jan Hatzius summarized his view on the key economic themes for 2020:
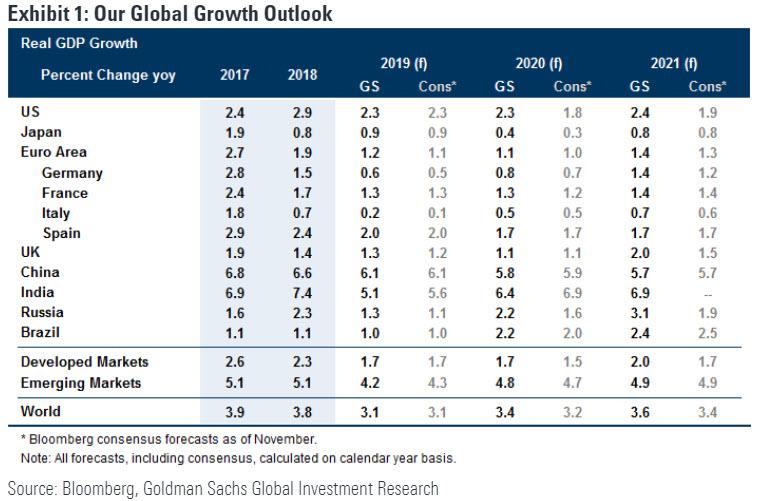
- Goldman expects the global growth slowdown that began in early 2018 to end soon, in response to easier financial conditions and an end to the trade escalation. Although annual-average GDP growth is likely to rise only modestly from 3.1% in 2019 to 3.4% in 2020, this to Hatzius “conceals a more pronounced sequential pattern of slowing growth this year and gradually rising growth next year.”

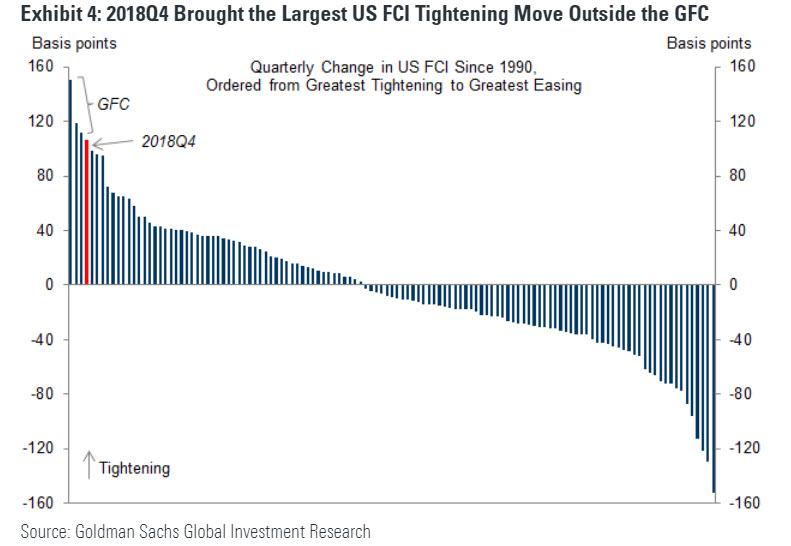
That said, take Goldman’s forecast (not just here but anywhere) with a bag of salt: as even Hatzius admits, the global economy in 2019 slowed “more sharply than expected” following what Goldman dubbed the biggest tightening in financial conditions outside the financial crisis which took place in Q4 2018, confirming that we will never again be able to normalize monetary policy just as Ben Bernanke once said…
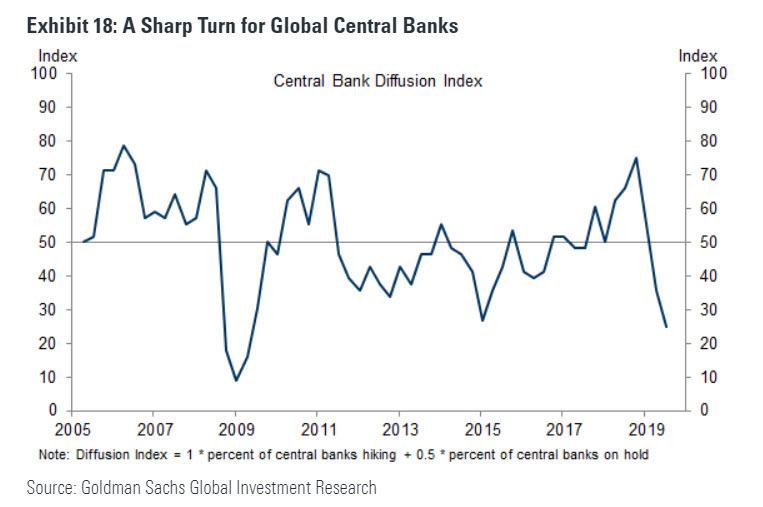
… and which in turn prompted more than 60% of all central banks to ease, and resulted in the best S&P performance since 2013, as the world’s most important market index is now up more than 24% YTD.
- According to Goldman, the risk of a global recession in the next 12 months has dropped from 30% recently to 20%, and remains more limited than suggested by the flat yield curve, “which partly reflects a structural decline in the term premium, and the low unemployment rate, whose predictive value for inflation and aggressive monetary tightening has fallen.” Goldman also points out the absence of significant private sector financial deficits in all but a few advanced economies.
- Goldman’s confidence that growth will improve sequentially is highest in the US, “where demand is most responsive to financial conditions, and the UK, where we expect the Brexit drag to reverse and fiscal policy to ease.” That said, the bank looks for a “more gradual” pickup in Europe, where the fiscal boost is likely to remain (too) limited, and Japan, where the bank is watching carefully for a negative impact from the October consumption tax hike. More importantly, Goldman now expects growth in China to slow modestly from just above 6% to just below, in line with gradually decelerating potential. As a reminder, it is Zerohedge’s view that absent a major stimulus/credit injection/inflation boost out of Beijing – which is now virtually impossible – a global growth rebound is virtually impossible.
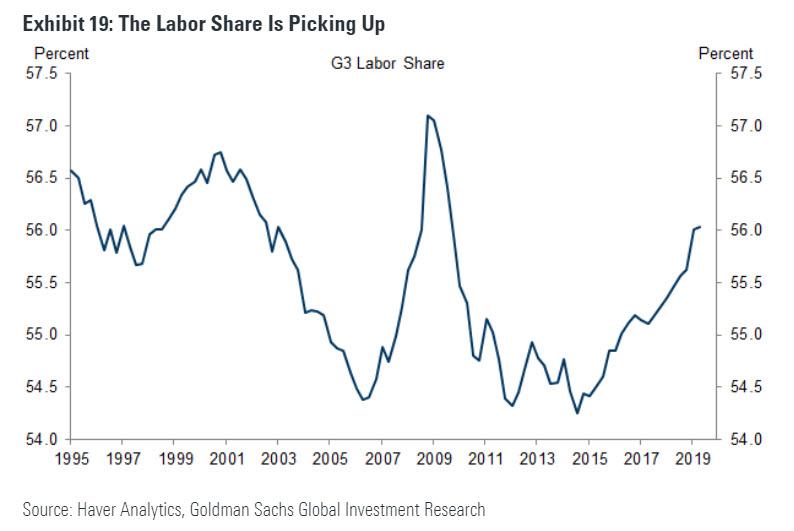
- Across advanced economies, Goldman expects “continued labor market improvement and upward pressure on wage growth, which is likely to push unit labor costs above central bank inflation targets.” However, the pass-through to core price inflation should remain limited because the price Phillips curve is much flatter than the wage Phillips curve given stable inflation expectations. In other words, wages will grow but inflation will not because the primary tool used by central bankers for decades was in fact, meaningless.
- In its baseline forecast, most DM central banks stay on hold in 2020. At least in the early part of the year, however – just like in 2019 – “the risk is on the side of further easing, especially in the Euro area and Japan where growth is weak and inflation far below target.” Which is ironic for a year in which Goldman sees an economic rebound but whatever.
- So with slightly better growth, limited recession risk, and friendly monetary policy Goldman forecasts “a decent background for financial markets in the early part of 2020.” However, concerns about the impact of higher corporate taxes on profits could rise in the runup to the US presidential election. Aside from politics, Goldman warns that rising wage growth looks set to reduce profit margins over the next several years.


Using this as a basis for his summary of the top ten themes for 2020, ironically called “Learning to Fly Without the Fed” (unless of course growth slows down or markets drop, in which case the Fed will come rushing right back in), Goldman strategist Lotfi Karoui and team put together this list of the top macro and market themes that he expects to dominate the investment landscape going into 2020, and which he summarizes it as follows “the stabilization in growth that we envisage should deliver decent risky asset returns, including in cyclicals tactically; but without the tailwinds from Fed (and ECB) easing, the upside in markets is likely to be more limited.“
- The beta view: Growth stabilization
- Relative value: Tactical upside in cyclicals but quality is still on top
- Earnings: Adjusting to flatter growth, with an eye on taxes
- Rates: Baby bear market
- FX: A tale of two Dollars
- Europe: Don’t fight the ECB
- China: When policy is doing just enough
- EM: Better growth, moderate returns
- Commodities: Over-built, over-levered and over-polluted
- Market liquidity: The unknown known
We’ll spend more time on this list in a subsequent post suffice to point out that in many ways, 2019 was a replay of the years just after the financial crisis, something which Karoui admits, stating that while “the last twelve months may have been bumpy for the global economy, they were mostly friendly for investors.”
Measuring from October 2018 to October 2019—in part to encompass both the December drawdown and January recovery in global equities—the MSCI All Country World Index produced a total return of about 13%, compared with an average annual return of 8% since 2010. Global credit markets delivered similarly impressive gains.
And the $64 trillion admission from Goldman: “With S&P 500 earnings on track for roughly zero growth from this time last year, solid returns likely would not have been possible without central bank support.” Indeed, both the Federal Reserve and the European Central Bank eased monetary policy, pushing long-term real interest rates down about 100bp in the US and 50bp in the Euro area. About how much did this lift risky assets? A standard approach based on the equity risk premium concept would say it accounts “for almost all of the price return since the start of the year.”

In other words, central banks – and central banks alone – were entirely responsible for this year’s 25% gain in the S&P.
With that admission out of the way, we will also point out the other notable theme for 2020 which will certainly dominate markets: market liquidity. Here we disagree with Goldman that this is the “unknown known” – market liquidity is by far the biggest risk facing markets where central banks are now a standard backstop. In fact, if there is to be a crash, or any other “event” which cripples central bank credibility, it will have to go through the liquidity channel, and 2020 may be the perfect year to test just that.
This is what Goldman writes on that topic:
For fixed income investors, particularly in less liquid markets like corporate credit or mortgages, episodes such as the one experienced in the repo market offered yet another valuable lesson: putting a price on liquidity risk has rarely been more challenging. Unsurprisingly, investors have responded by demanding a higher premium against liquidity risk. In the relatively liquid agency MBS market, the steady spread widening throughout the year has partly been driven by a gradual increase in the liquidity premium. This repricing reflects the strong reliance of the “To Be Announced” (TBA) agency MBS market on so-called Dollar roll transactions. The same forces that have fueled stress in the repo market have also increased the costs of financing TBA trades.
In our view, the deterioration in market liquidity conditions is a major source of vulnerability that investors need to constantly anticipate and appropriately price, especially in the less liquid corporate bond market. The combined effect of higher capital and liquidity requirements has improved the resilience of banks. But this improved resilience has also reduced bank balance sheet flexibility and diminished the ability to respond to stronger liquidity demand at times of elevated market stress.
Goldman’s summary:
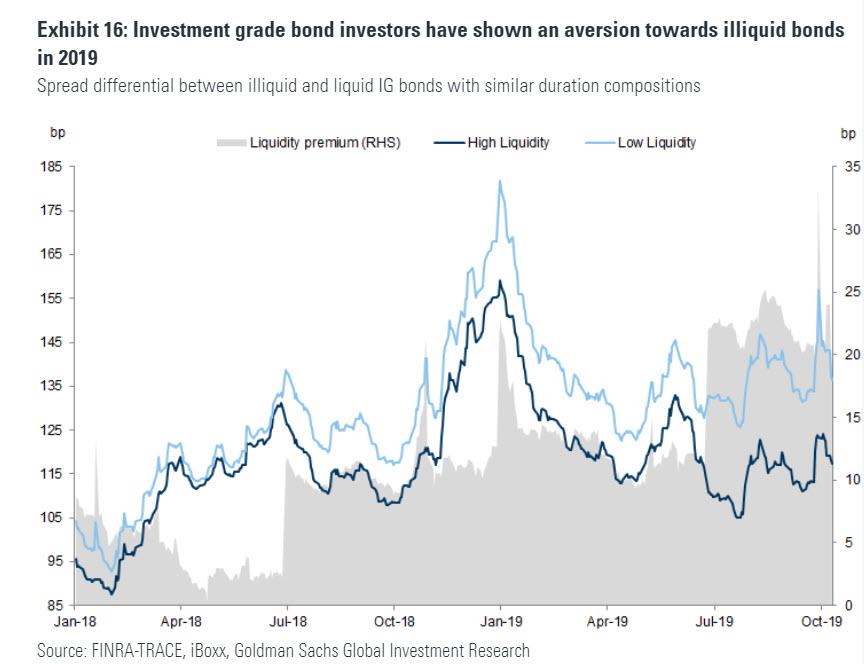
… liquidity conditions in the corporate bond market have generally deteriorated since the crisis. In a nutshell, the market has become more fragmented, with notable declines in the share of block trades as well as in the average institutional trade size. Alongside greater fragmentation, depth has also waned, with a sharp decline in market turnover and generally higher price impact estimates of the order flow for institutional trades. Barring a severe repricing of liquidity premia, we think these structural changes make the value proposition of owning illiquidity in the publicly traded corporate bond market rather weak.
We’ll have more to say about all this in a subsequent post, but we wanted to complete this post by looking at what Goldman believes are the best trades to emerge from the above assumptions. Naturally, we don’t suggest that these trades will work: Goldman has been notorious with how bad its best trades can get. As a reminder, the bank closed out 5 of its top 6 trades for 2016 just over a month into the year!
Instead, we suggest readers use these as a framework of what may work if one agrees with Goldman’s assumptions. In theory, these are the trades with the best return potential if Goldman is correct about what happens with the economy. Obviously, if one disagrees with the now defanged vampire squid (which has been forced to issed subprime credit cards to remain relevant even as it barely pays its bankers any more), one should apply the opposite trade or trades.
And so without further ado, here are Goldman’s “Best Trade Ideas Across Assets.”
1. Global growth stabilization
- Stay long 10y US breakevens
- Long MSCI EM Index, with a hedge
- Long the S&P GSCI Enhanced index
- Long cyclical vs defensive EM equities
- Stay short EUR/SEK
- Long a select basket of EM HY credits
2. Quality still on top
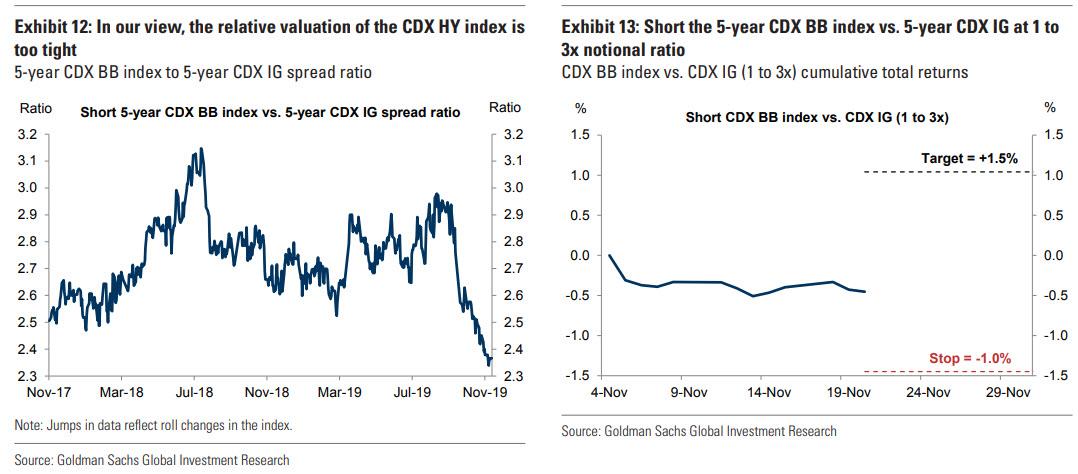
- Short the 5-year CDX BB index vs. 5-year CDX IG at a 1 to 3x notional ratio
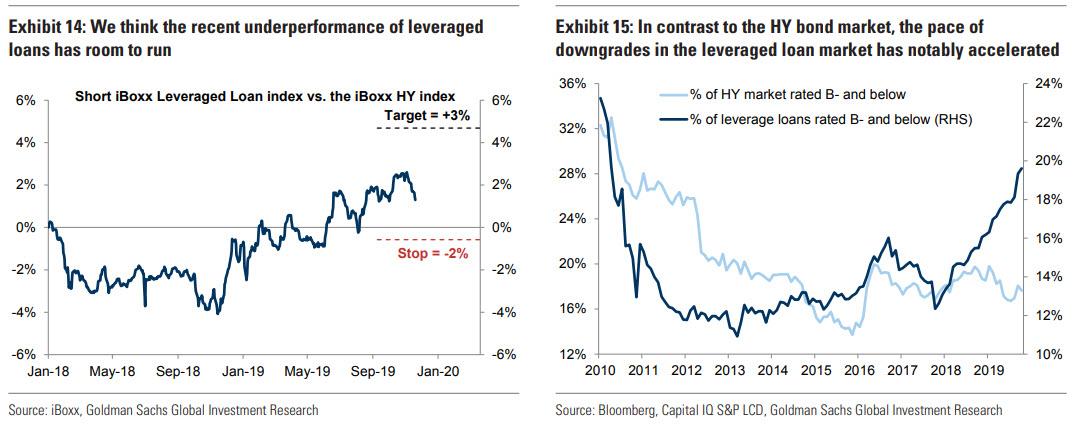
- Short the iBoxx Leveraged Loan index vs. the iBoxx HY index
3. Fed to the sidelines
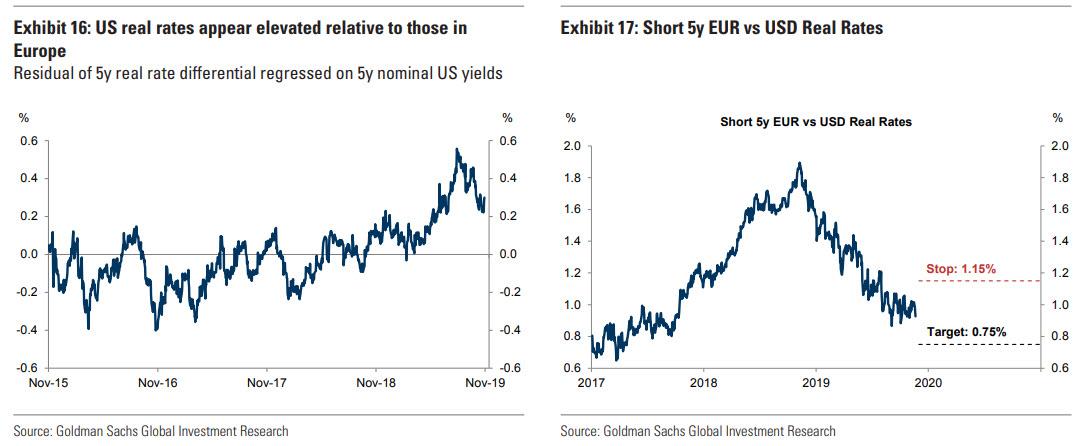
- Short 5-year EUR versus USD real rate
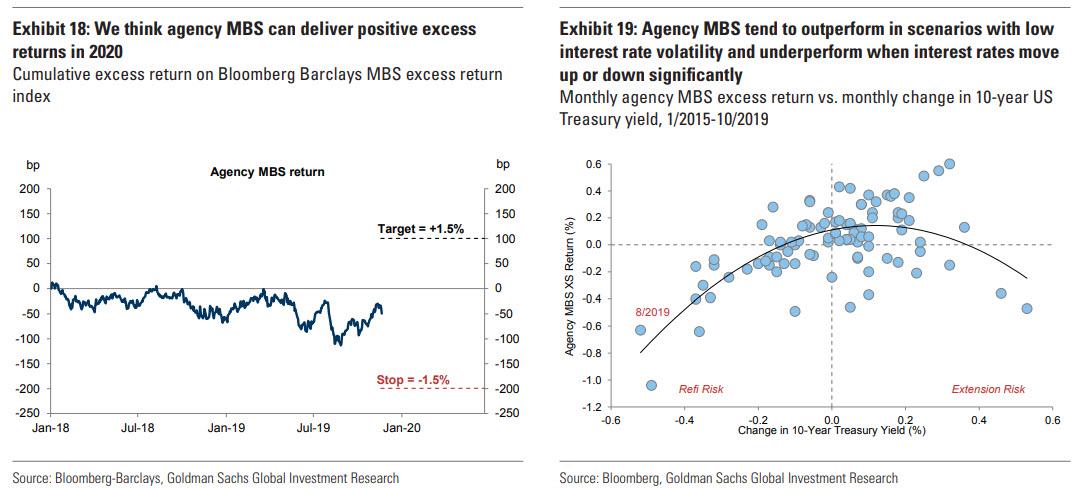
- Long US agency MBS, rates-hedged
- Stay in US 2s10s OIS swap spread curve flattener
4. Don’t fight the ECB
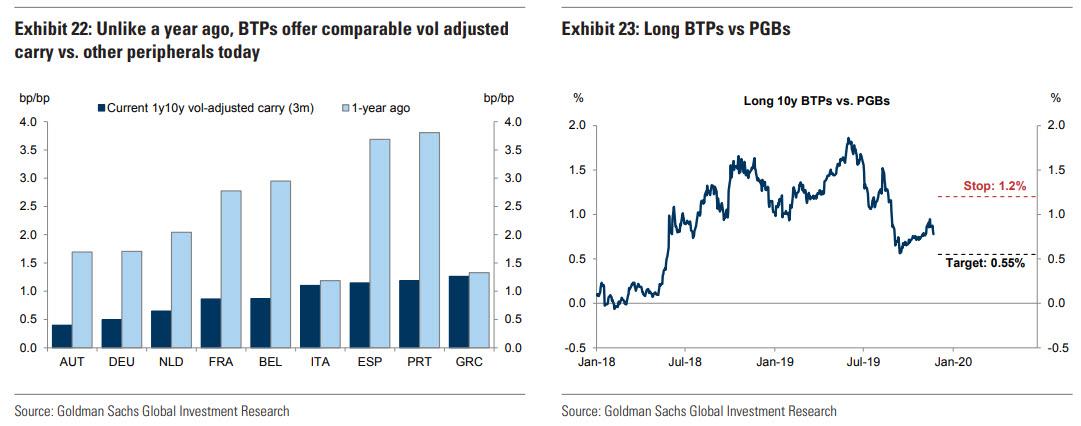
- Long BTPs versus PGBs
- Long the EUR iBoxx Contingent Convertible Liquid Developed Market AT1 index
5. Brexit breakthrough
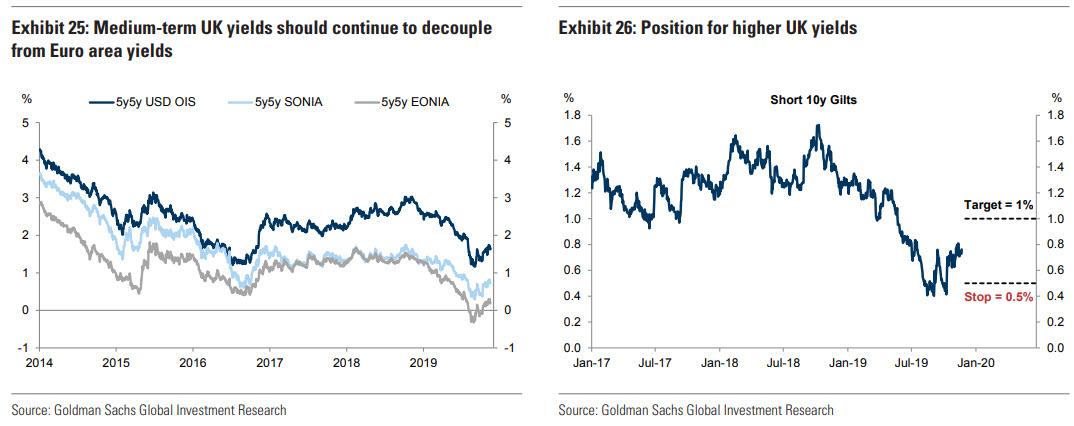
- Short 10y Gilts
- Short EUR/GBP
6. EM FX: Go for carry
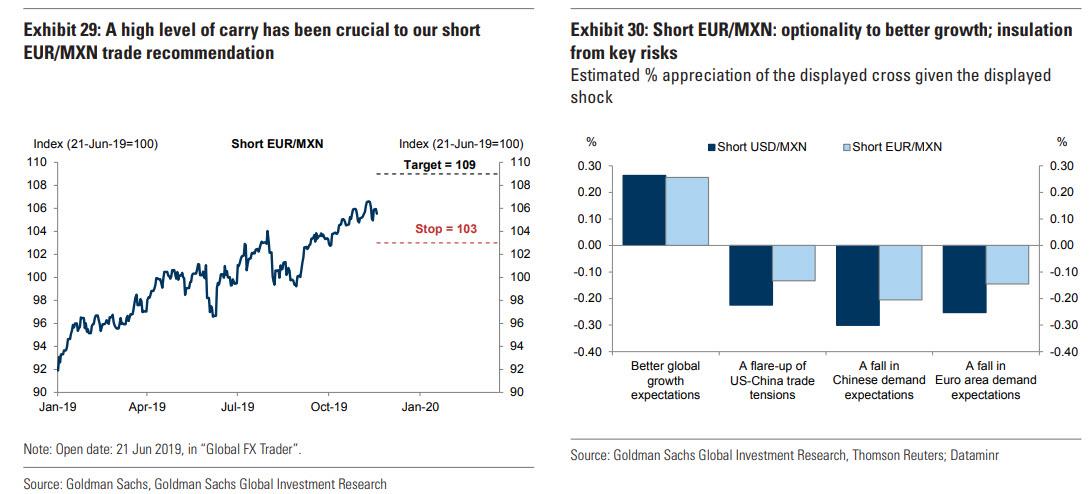
- Stay short EUR/MXN
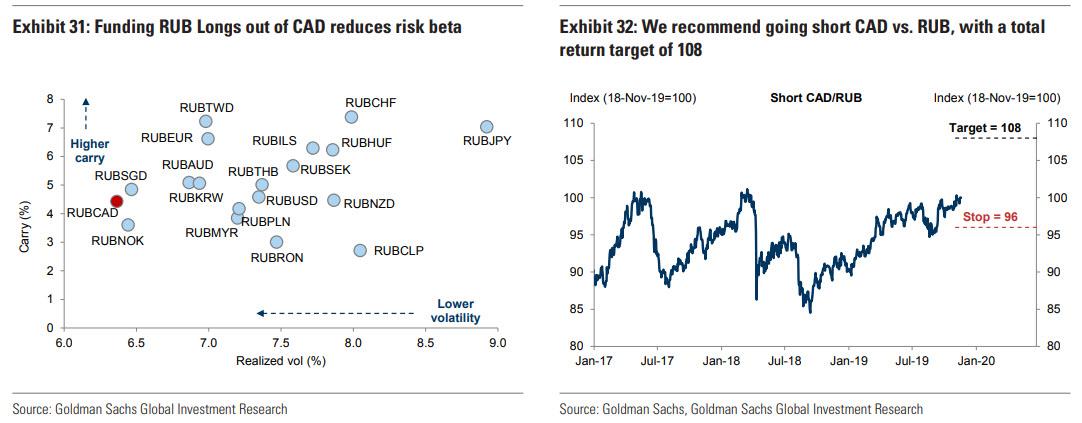
- Short CAD/RUB
- Long IDR vs TWD
7. Not done easing yet
- Receive THB 2Y IRS
- Receive KRW 1Y fwd, 2Y
Below we provide some more details on a selection of the abovementioned trades:
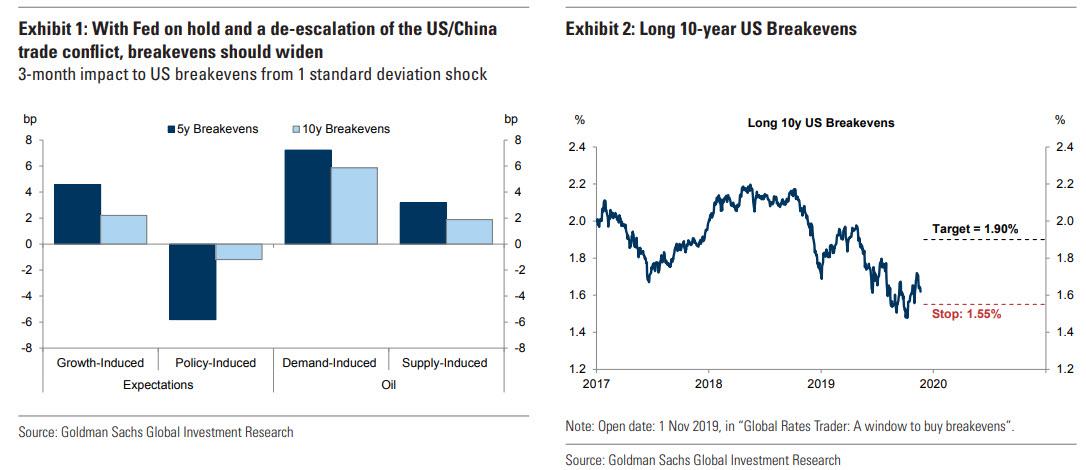
Stay long 10y US breakevens; target: 1.9%, stop loss: 1.55%. US breakevens still look cheap within the context of our fair value framework, where recent improvements in growth sentiment have been supportive. An additional reason to own breakevens is that spot inflation continues to run well ahead of traded inflation, which historically tends to result in some convergence (implying upside to breakevens against a stable inflation backdrop). Finally, the Fed has telegraphed a high bar to tighten policy, which should also be a net positive.
Long EM equities, hedged with a March 31, 2020 put, struck 5% OTM. Heading into 2020, we expect the news and data flow to remain supportive for cyclical assets. For EM equities specifically, the backbone of our positive view is the expectation of better earnings, as the current MSCI EM P/E of 12.4x (85th %-ile vs history) makes additional valuation upside unlikely (Exhibit 3). Downside risks remain, but by the end of March we expect global markets to digest two major pieces of information: (1) whether macro data will reaccelerate, and (2) the risks surrounding the US presidential election. Given our macro views, we recommend that investors continue to position for an improving EM growth story, while hedging against potential left-tail risk events.

Long S&P GSCI Enhanced Total Return Index at 407 with a target of 440 (+8% return) and a stop at 387 (-5% loss). We believe that old-economy de-leveraging will continue to be a key theme in 2020, with companies more focused on debt reduction as opposed to earnings growth as the way to de-lever. This suggests that old-economy capex will continue to fall and companies will focus on using cash flow to pay back debt. As a result, marginal producers will look more and more like a bond, with the need to secure earnings through hedging. This should anchor commodity forward curves near cost support as producers under financial distress will likely continue to hedge aggressively into price rallies to boost weak returns. In contrast, the capex declines will keep prompt supplies tight where inventories have already been depleted due to heightened political uncertainties and destocking. This should keep spot prices above forward prices in key markets, supporting backwardation. This carry sits at the core of our bullish view on commodity returns despite expecting commodity prices outside of copper to trade sideways during 2020.

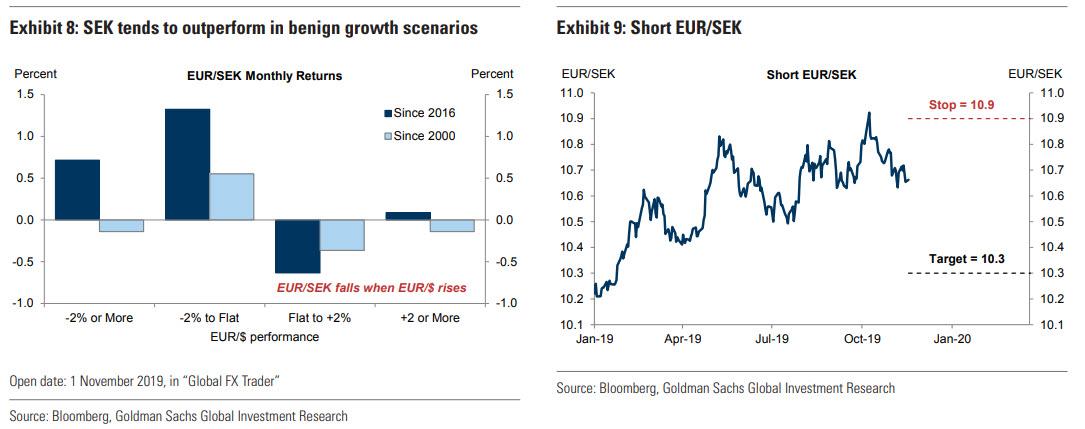
Stay short EUR/SEK; target: 10.30, stop loss: 10.90. Sweden, the most open economy in the G10, stands to benefit from improving global growth and lower recession risk in the Euro area. SEK tends to outperform in relatively benign growth scenarios with a modestly stronger Euro (Exhibit 8), which is close to our baseline scenario of a better—but not stellar—global environment. The trade should also benefit from asymmetric monetary policy reaction functions. While a number of global central banks (including the ECB) appear to have a lower hurdle for cuts than hikes, the Riksbank has shown a strong desire to get out of negative territory. We therefore think that it is highly likely to hike in December, and will then be reluctant to cut even if data deteriorate further.
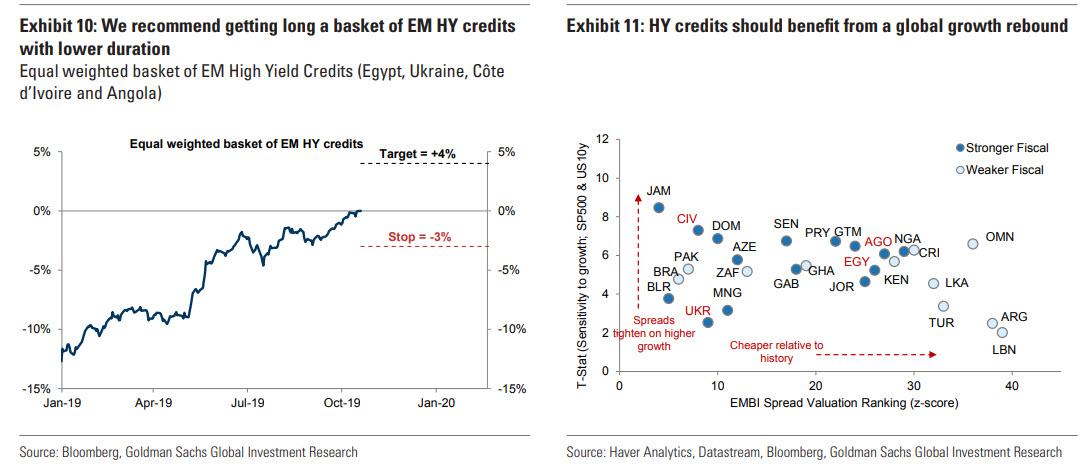
Long a basket of EM HY credits (Egypt, Ukraine, Côte d’Ivoire and Angola) with stronger fiscal outlooks and shorter duration; total return target 4%, stop loss: -3%. Against a backdrop of improving cyclical data in coming months, we see room for total returns of EM HY credits with stronger fiscal outlooks to outperform, given their higher sensitivity to global growth risk and more attractive valuations. An equally weighted basket of Egypt, Ukraine, Côte d’Ivoire and Angola offers an overall positive exposure to a growth and risk rebound (i.e., higher S&P 500 and higher 10y UST yields), and belongs to the group of HY credits which either have more fiscal space or are aiming to consolidate their fiscal balances (Exhibit 11). While both Ukraine and Côte d’Ivoire are at the tighter end of their price history, the basket still offers a decent yield-pickup at ~5.6%, with ~3.9 years duration (vs 5.2% yield and 7.4 year duration for the EMBI Div. index). While this basket of EM HY credits aims to diversify from a number of idiosyncratic risks among the selected credits, it is important to recognize that these are still low-rated single B credits.
Short the 5-year CDX BB index vs. 5-year CDX IG at 1 to 3x notional ratio. We recommend getting short the CDX BB vs. CDX IG at a 1 to 3x notional ratio, with an initial total return target of 1.5% and a stop loss of -1%. The trade is slightly positive-carry, at roughly 30bp per annum. Given that the large majority of CDX IG is BBB-rated, we view this trade recommendation as a liquid implementation of our preference for BBBs over BBs. As shown in Exhibit 12, this year’s strong performance of the “up in quality” theme in the high yield market has significantly eroded the risk premium available in the BB index relative to CDX IG. We think the recent outperformance of the BB index is overdone and expect that CDX IG will likely outperform for three reasons. First, we think the premium embedded in the BB index is too thin relative to the BBB bucket. At roughly 124bp, the CDX BB index is now the tightest it has been since the crisis and offers a thin compensation against future losses, in our view. For context, the average annualized 5-year loss rate for a portfolio of BB-rated bonds stands at 95bp, according to Moody’s. And our own forecast of 72bp, while lower, still implies a thin premium net of expected losses. Second, 10 out of the 125 constituents of the CDX IG index trade in the vicinity of or wider than the CDX HY BB index. In our view, this “downgrade premium” is attractive given what we think is the relatively small likelihood of a wave of downgrades into HY (at least absent a recession). Third, while the weakness in earnings growth this year has delayed the debt reduction plans among large BBB-rated issuers, our recent review of capital management commentary from some of the largest BB-rated issuers suggests a growing appetite to utilize financial flexibility and debt capacity for M&A and shareholder returns. By contrast, the mindset among BBB-rated issuers remains more conservative from a bondholder standpoint.
Short the iBoxx Leveraged Loan index vs. the iBoxx HY index at a 1.25x to 1 notional ratio. We recommend getting short the iBoxx Leveraged Loan index vs. the iBoxx HY index at a 1.25x to 1 notional ratio, with an initial total return target of 3% and a stop loss of -2%. Overweight HY bonds vs. leveraged loans has been one of our key relative value themes since early June of this year. While the view has performed well over the past few months (Exhibit 14), we see three reasons why it has room to run. First, the fundamental picture in the leveraged loan market remains challenging, more so than in the HY market. One concerning trend has been the significant uptick in the pace of downgrades at the low end of the rating spectrum, a sharp contrast with the rather benign picture in the HY bond market (Exhibit 15). Second, supply/demand technicals have turned more fragile in the leveraged loan market. Net supply has cooled down relative to last year but demand technicals have weakened. The large and persistent outflows from bank loan mutual funds and ETFs have essentially turned the leveraged loan market almost entirely dependent on the “CLO bid”. And with CLO creation trailing last year’s volumes by 10%, the absence of a “natural marginal buyer” is a source of fragility for the secondary market. Moreover, most CLOs have concentration limits on CCC-rated risk, which, given the negative rating migration trend shown in Exhibit 15, could become another headwind for the market. Finally, compositional differences across sectors favor the HY bond market, in our view. The leveraged loan market has a higher index weighting to Technology (14.7% vs. 6.5% in the HY bond market) and Healthcare (9.4% vs. 6.3%). As US-China trade tensions look likely to persist over the long term (despite the preliminary Phase One agreement), and election rhetoric intensifies, these sectors may be more vulnerable to weakness.
Short 5-year EUR versus USD real rate; target: 0.75%, stop loss: 1.15%. Asymmetry in monetary policy space available to the Fed and ECB should mean US-Euro area yield spreads should trade with a structural tightening bias. In the event of a negative economic shock, the greater distance from the effective lower bound in the US should allow for a steeper decline in yields relative to the Euro area. The outcome is similar in a positive economic shock scenario; with more negativity priced in the Euro area, there is simply more room to bounce there. We prefer a real rate to a nominal rate expression as we are mildly positive on US inflation over the medium term, but negative on Euro area inflation compensation. Additionally, the real rate differential looks wide versus the level of nominals (Exhibit 16). The risk to the trade is that economic divergence between the US and Euro area continues, although we think the scope for yield divergence is somewhat limited given cross-border capital flows.
Long US agency MBS, rates-hedged. We recommend getting long US agency mortgage-backed securities (MBS), rates hedged, with a total return target of +1.5% and stop loss of -1.5% (Exhibit 18). We recommend implementing this trade via a 4.5% coupon 30-year conventional MBS, hedged by a portfolio of 2-year and 10-year Treasury instruments at hedge ratios of 1.0 and 0.05. The key ingredient to this trade recommendation is our expectation of bounded interest rate volatility over the early portion of 2020. Owing to the negative interest rate convexity of mortgages—derived from the underlying borrowers’ embedded option to refinance their mortgages at any time—agency MBS tend to underperform in an environment of volatile rates (i.e., large interest rate moves up or down) and outperform amid range-bound rates (Exhibit 19). The significant underperformance of agency MBS vs. other risk assets in 2019 provides an attractive entry point for the trade. In our view, the widening of mortgage spreads has been driven by elevated refinance risk, as interest rates declined on the year. But at current levels, we think the risk is appropriately priced.
Long BTPs versus PGBs; target: 0.55%, stop loss: 1.2%. Given the proximity of rates to the lower bound in Europe, the hurdle for a broad duration rally is higher. However, we do expect that a stabilization in cyclical data will continue to support spreads. The compression in European government bond yields has equalized risk-adjusted carry across the sovereign credit spectrum (Exhibit 22). Given the limited prospects for significant capital appreciation, the bulk of returns are likely to come from carry. We think recent weakness in BTPs offers an attractive entry point for longs vs Portugal (Exhibit 23). This expression harvests carry, while providing some inoculation against further cyclical weakness in Europe, which could see spreads move higher across the periphery—particularly in higher beta economies such as Portugal. The clearest risk to the trade is renewed political risk for Italy—we think the passage of next year’s budget later this year will forestall these risks until later in 2020.
Short 10y Gilts; target: 1%, stop loss: 0.50%. We expect the Brexit process to move closer to resolution post-election. This would allow not only for term premium decompression, but also for yields to price a potential fiscal expansion, leading to further on the fiscal front in the United Kingdom than almost anywhere else—after all, both major parties are effectively committed to higher government spending, which at least partially would result in higher issuance. An easier fiscal stance would enable rates to drift higher towards the neutral rate, and although it has likely slipped as a result of Brexit-related uncertainty, it is still above where markets are pricing longer-run rates. A near-term risk to this trade is that the election produces a hung parliament, which would likely prolong Brexit uncertainty, and in turn push the Bank of England towards cuts.
Stay short EUR/MXN for an 8% annual carry and optionality to better growth; total return target (revised to) 109, stop loss (revised to) 103. Staying short EUR vs. long MXN offers very attractive carry: roughly 8% nominal annualized. Since we initiated this trade recommendation five months ago, carry has accounted for more than half of the potential total return accumulated so far (Exhibit 29). The trade idea also provides optionality to a brightening of global growth: a short EUR/MXN view scans as relatively ‘risk-on’ overall and, in particular, our metrics suggest the view is likely to do well against a moderate improvement in risk sentiment and core yields, particularly if, as we expect, US consumer demand—to which Mexico is significantly levered—remains robust.
Short CAD/RUB: a low-vol way to get long RUB; total return target of 108 and a stop of 96. On a total return basis, the Ruble is one of our favourite longs in EM FX. On the macro front, Russia features a still-strong current account surplus, a wide output gap that suggests the potential for a growth improvement in 2020, and a real rate buffer that may help reduce the FX headwinds of Russia’s ongoing cutting cycle. On a tactical basis, the RUB features perhaps the most attractive combination of high carry and significant exposure to a further rally in global equities into year-end. While we are cautiously optimistic on the global environment, we think going short USD/RUB is likely too ‘risk-on’ for now; as a result, we suggest funding RUB longs out of the CAD: a currency which shares, to an extent, the high sensitivities of the Ruble to both risk sentiment and oil prices.
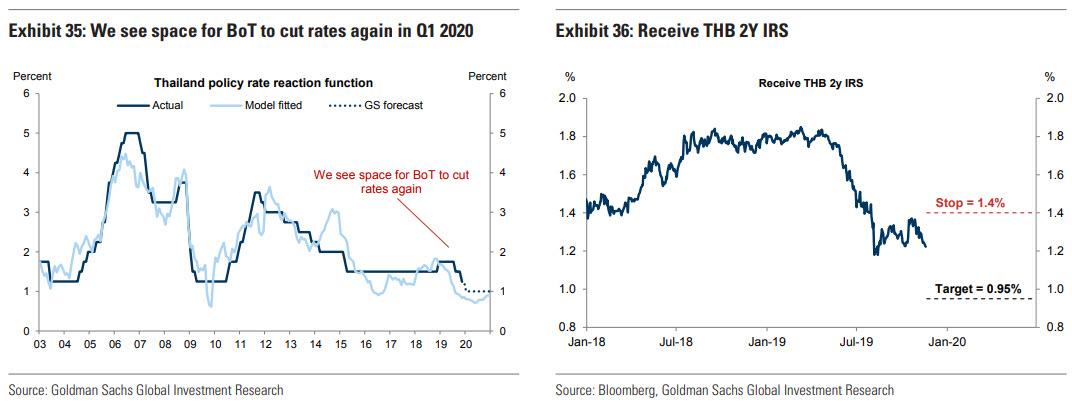
Receive THB 2Y IRS with a target of 0.95% and stop-loss of 1.40%. Thailand’s fixed income market has rallied by 50-70bp this year in a bull-steepening fashion amid 50bp worth of BoT policy rate cuts. We have revised our view and expect the BoT to deliver another 25bp cut in Q1 2020 (Exhibit 35). We expect growth to rebound slightly from 2.4%yoy in 2019 to 2.8%yoy in 2020, although this is still below potential of 3.1%. The delay in the passing of the FY2020 budget (from October 1 to likely January 2020) has resulted in a significant fiscal drag in late 2019, which should reverse slightly in 2020. Nevertheless, following our recent trip to Thailand, we remain skeptical that there will be significant progress in infrastructure projects in 2020, or at least capital expenditure will likely be below planned spending (judging by historical patterns), while several projects are likely to experience delays. Although we think Thailand has significant room for more fiscal spending, with a debt-to-GDP of around just 42% (versus a ceiling of 60%), further delays in public and private investment mean that the authorities will need to rely on monetary policy again. Moreover, THB was the second-strongest performing currency in all of EM this year (+7% vs. USD). The BoT has announced several measures to curb THB strength, but we think the impact should be limited in the near term. Thus, with growth below potential, inflation below the bottom end of the target range, currency strength and lack of significant progress on infrastructure projects, we expect the BoT to cut rates again in Q1 2020.
Tyler Durden
Fri, 11/22/2019 – 12:01
![]()
Zero Hedge’s mission is to widen the scope of financial, economic and political information available to the professional investing public, to skeptically examine and, where necessary, attack the flaccid institution that financial journalism has become, to liberate oppressed knowledge, to provide analysis uninhibited by political constraint and to facilitate information’s unending quest for freedom. Visit https://www.zerohedge.com