CTAs Caught In A Tug Of War Between Bonds And Stocks As Year-End Looms
While the jury is still out whether the modest economic rebound that took place at the start of September – just in time to crush the value/growth trade – and appeared to fizzle by mid-November, when the “jitters” returned to virtually every asset class except stocks which have continued to ramp to new all time highs …
… is over, and a new wave of economic uncertainty and/or deflation has set in, remains to be seen.
Which is why in the absence of definitive macro trends, traders will be looking at the next best, and most important thing: what CTAs will do, especially as traditional year-end market patterns begin to take hold next week, now that the majority of hedge funds have been incrementally ramping up their risk-taking in a scramble to catch up to the market, and with optimism toward US-China talks still strong.
So what do positional indicators tell us?
According to Nomura’s Masanari Takada, amid the ongoing market euphoria – a consequence of the Fed’s QE which has pushed the Fed’s balance sheet and stocks higher for 7 of the past 8 weeks…

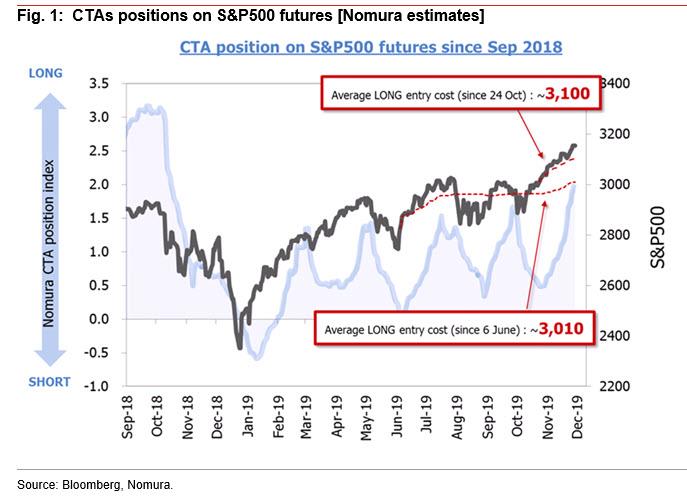
… it is now high time to look more cautiously at the steady accumulation of long positions on US equity futures (S&P 500, NASDAQ 100, DJIA) by trend-following CTAs that is one of the factors behind the strength of the US equity market (perhaps the explanation is as simple as that CTA buy if the Fed’s balance sheet rises, and vice versa).
Looking at the action in the last days of last week, CTAs were in wait-and-see mode, but Nomura expects them to continue to lean toward buying, especially since their long positions have already reached the levels last seen in mid-October 2018, and they have been steadily hiking their leverage ratios (re-leveraging). Of course, if CTA demand overextends, Nomura warns that the upward momentum in US stocks could lead to an overheating – assuming of course that the last 100 or so S&P points were not just that – “and markets are then likely to start viewing day-trading moves by fleet-footed investors with trepidation.” Meanwhile, a modest cool-off in stocks, one that doesn’t bring the S&P 500 down past around 3,100 (breakeven for CTAs’ most recent positions), could conversely spur dip-buying by investors that have fallen slightly behind this trend.
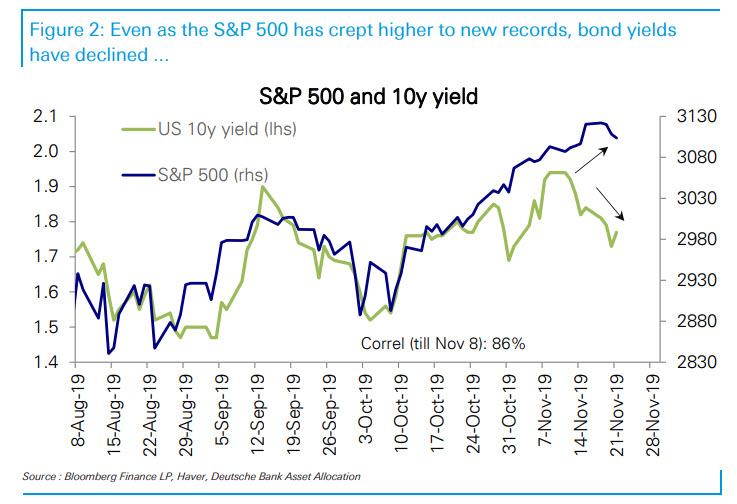
What about bonds? As we wrote three weeks ago, when bond yields peaked just shy of 2%, that’s the time that CTAs stopped selling Treasurys, and sure enough, 10Y yields promptly dropped by over 20 bps. Fast forward to today, when 10yr TSY yields can be found around 1.76%, a level that Nomura says is “a key strategic line for CTAs”, as it represents the cost of cumulative net buying since June.
As a reminder, CTAs have already unwound nearly 80% of their long UST (TY) positions, and it is more difficult for them to unwind these positions in the interest of avoiding losses with yields at 1.7-1.9%. If anything, if trade war fears re-emerge and deflationary worries bubble up to the surface again, it is more likely that CTAs will start buying here again, potentially sending 10Y yields south of 1.50% in a hurry.
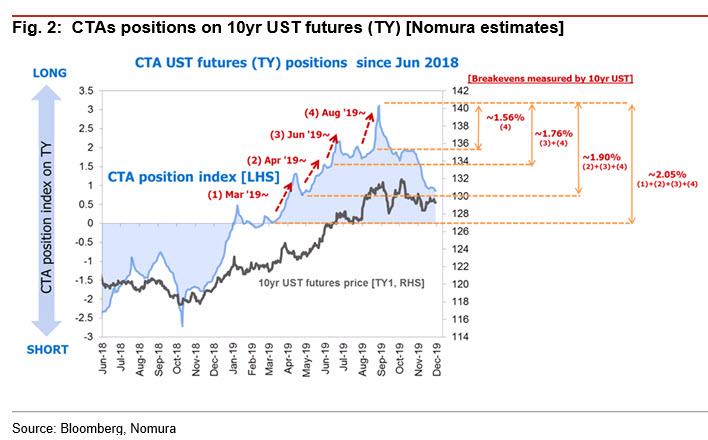
Of course, position adjustments within the range of what can be justified by actual market conditions cannot be ruled out, but as Nomura notes, there now seems to be little risk that CTAs will unilaterally sell off their long positions unless 10yr UST yields were to break above 1.9%.
In short, with just one calendar month left in the year, and the decade, what happens next may depend on the tug of war between equity and bond CTAs, and which group ends up prevailing.
And since the outcome of that particular duel is still unknown, we will instead shift our perspective a bit and look at cross-asset seasonal patterns for the end of this year and the beginning of the New Year.
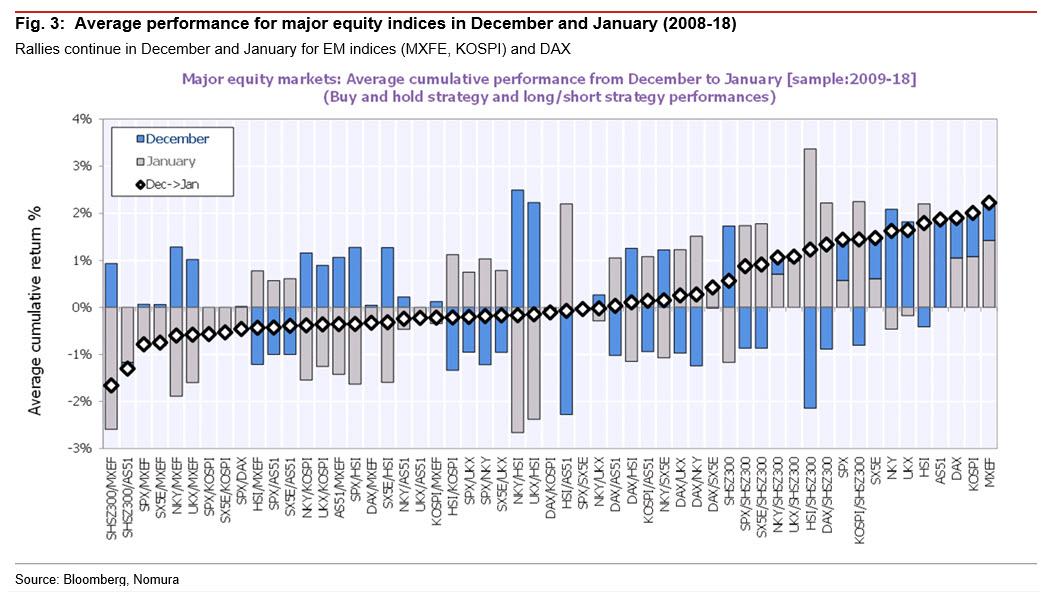
Here, we highlight Nomura’s calculations for the average performance in December and January since 2009 for investment in equity, FX, and 10yr yields (in all cases assuming that positions are held from the first trading day through the last trading day). For the 10 major asset classes, the Japanese bank compared a total of 55 patterns for building buy & hold or long/short positions.
Among major equity markets, EM equity indices such as MSCI-EM and KOSPI tend to maintain upward momentum in December and January. In contrast, indices such as the Nikkei 225 and CSI 300 tend to rise in December but reverse in January. The S&P is modestly in the positive category, with strong seasonals for both December and January.
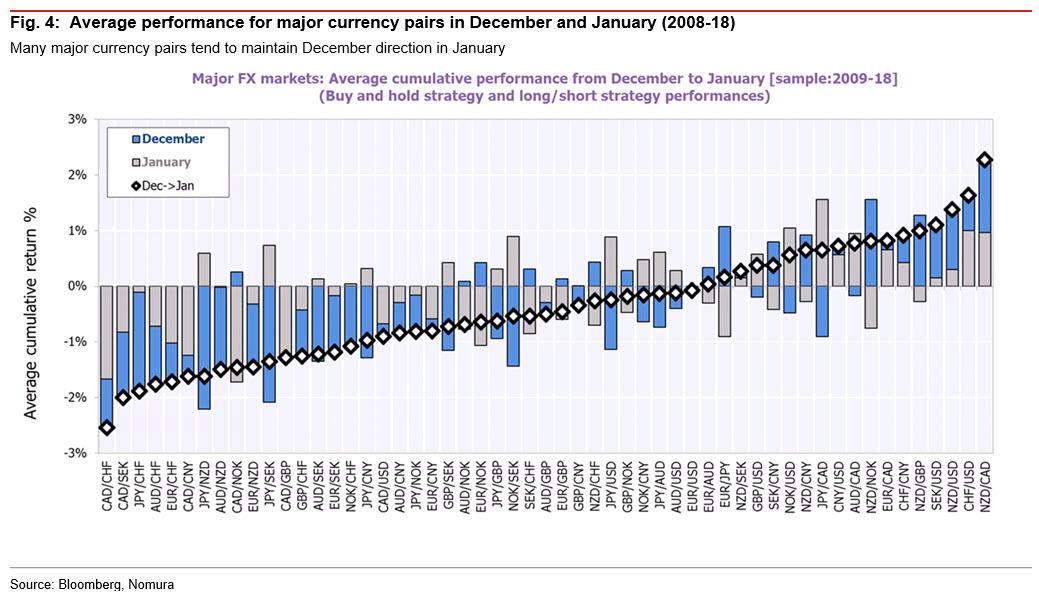
In FX, NZD cross pairs tend to move in the same direction in both December and January. In contrast, EUR/JPY and NZD/NOK tend to rise in December and then reverse in January, while NOK/SEK tends to fall in December and then reverse and rise in January. In either case, many currency pairs maintain momentum from December through January better than equity or rates.
Finally looking at 10yr yields, it appears that 10yr UST yields and yields in the majority of other countries tend to rise in December and then fall in January. Compared with equity and FX, 10yr yields show a clear tendency to revert to the mean from the end of the year through the beginning of the next.
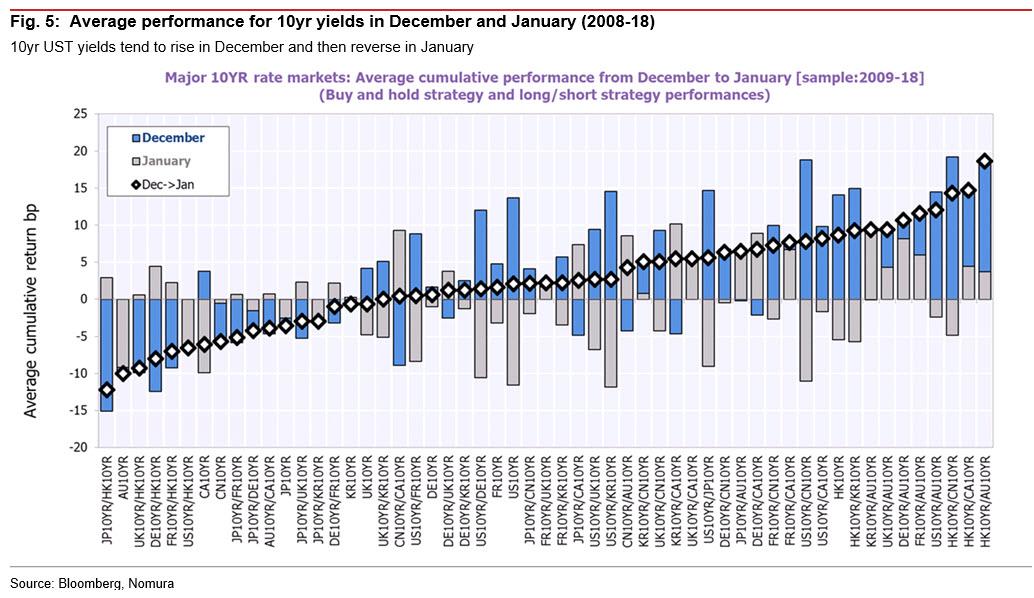
In light of this, and until CTAs show their cards how they plan on trading the balance of the year, Nomura concludes that it seems that an effective strategy for targeting momentum effects from December through January could be to build long/short positions in, for example, HK10yr/AU10yr.
Tyler Durden
Sun, 12/01/2019 – 11:00
![]()
Zero Hedge’s mission is to widen the scope of financial, economic and political information available to the professional investing public, to skeptically examine and, where necessary, attack the flaccid institution that financial journalism has become, to liberate oppressed knowledge, to provide analysis uninhibited by political constraint and to facilitate information’s unending quest for freedom. Visit https://www.zerohedge.com