
Is Inflation Really Under Control?
Authored by Patrick Hill via RealInvestmentAdvice.com,
Recently, analysts have been discussing the pros and cons of using negative interest rates to keep the U.S. economy growing. Despite this, Fed Chairman Jerome Powell has said that he does not anticipate the Federal Reserve will implement a policy of negative interest rates as it may be detrimental to the economy. One argument against negative interest rates is that they would squeeze bank margins and create more financial uncertainty. However, upon examining the actual rate of inflation we are likely already in a ‘de facto’ negative interest rate environment. Multiple inflation data sources show that actual inflation maybe 5%. With the ten year Treasury bond at 1.75%, there is an interest rate gap of – 3.25%. Let’s look at multiple inflation data points to understand why there is such a divergence between the Fed assumptions that inflation is under control versus the much higher rate of price hikes consumers experience.
In October, the Bureau of Labor Statistics (BLS) reported that the core consumer price index (CPI) grew by 2.2% year over year. The core CPI rate is the change in the price of goods and services minus energy and food. Energy and food are not included because they are commodities and trade with a high level of volatility. However, the Median CPI shows a ten year high at 2.96% and upward trend as we would expect, though it starts at a lower level than other inflation indicators. The Median CPI excludes items with small and large price changes.

Source: Gavekal Data/Macrobond, The Wall Street Journal, The Daily Shot – 11-29-19
Excluding key items that have small and large price changes is not what a consumer buying experience is like. Consumers buy based on immediate needs. When a consumer drives up to a gas pump, they buy at the price listed on the pump that day. Consumers buying groceries don’t wait for food commodity prices to go down; they have to pay the price when they need the food. Recent consumer purchase research shows that prices of many goods and services continue to increase at a rate much higher than 2.2%.
Gordon Haskett Research Advisors conducted a study by purchasing a basket of 76 typical items consumers buy at Walmart and Target. The study showed that from June 2018 to June 2019, prices increased about 5%.
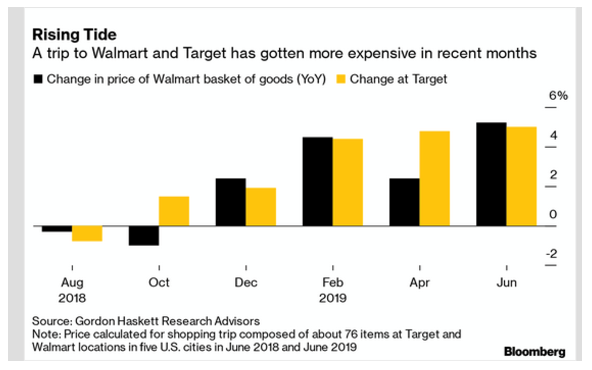
Sources: Gordon Haskett Research Advisors, Bloomberg – 8/10/19
Walmart and Target are good proxies for consumer buying experiences. Walmart is the largest retailer in the U.S. with over 3,000 locations marketing to price-conscious consumers. Target has 1,800 locations in the U.S. and is focused on a similar consumer buyer profile, though a bit less price sensitive. Importantly, both Walmart and Target have discount food sections in their stories.
Housing has been rapidly increasing in cost as well. Rental costs have soared in 2019 as the following chart shows a month over month shift to .45%, which is an annualized rate of 5.4%.
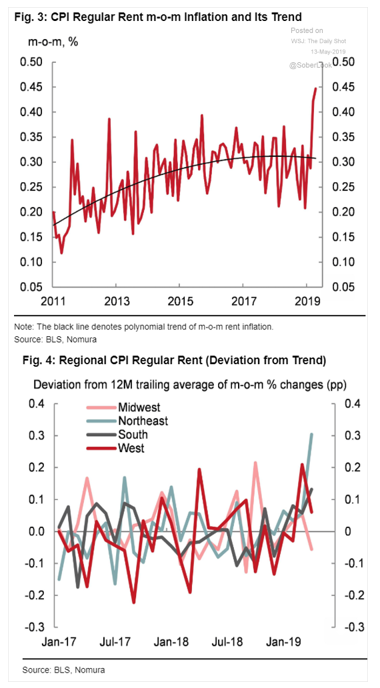
Sources: Bureau of Labor Statistics, Nomura – 5/13/19
The costs of other services like health care and education have increased dramatically as well. Service sectors, which make up 70% of the U.S. economy, are where wages are generally higher than in manufacturing sectors. Techniques to increase service productivity have been slow to implement due to service complexity. Without productivity gains, prices have continued to rise in most services sectors.
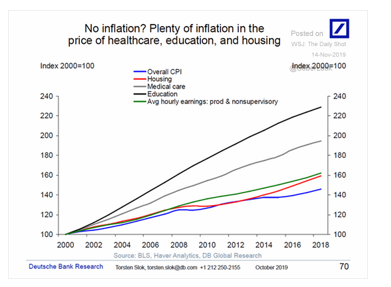
Sources: Deutsche Bank – 11/14/19
Medical care costs have increased by 5.2% per year, and education costs have risen 6.8 % per year. Wages of non-supervisory and production workers have fallen behind at 3.15 % increase per year. Note that the overall CPI rate significantly underestimates the rate of costs in these basic consumer services, likely due to underweighting of services in the cost of living calculation.
For many consumers, housing, utilities, health care, debt payments, clothing, and transportation comprise their major expenses. Utility and clothing costs have generally declined. While transportation, housing, and health care costs have increased. The rate of new car annual inflation was as low as 1 percent in 2018. Yet, according to Kelly Blue Book, the market shift to SUVs, full-sized trucks, and increasing Tesla sales have caused average U.S. yearly vehicle prices to zoom 4.2% in 2019. The soaring price of vehicles has caused auto loans to be extended out to 7 or 8 years, in some cases beyond the useful life of the car.
Dealers are financing 25% of new car purchases with ‘negative equity deals’ where the debt from a previous vehicle purchase is rolled into the new loan. The October consumer spending report shows consumer spending up by .3% yet durable goods purchases falling by .7% primarily due to a decline in vehicle purchases. A 4.2% increase in vehicle prices year over year is unsustainable for most buyers and indicates likely buyer price resistance resulting in falling sales. The October durables sales decline could have been anticipated if inflation reporting was based on actual consumer purchasing experiences.
The trade wars with China, Europe, and other countries are contributing to significant price increases for consumer goods. Tariffs have driven consumer prices higher for a variety of product groups, including: appliances, furniture, bedding, floor coverings, auto parts, motorcycles, sports vehicles, housekeeping supplies, and sewing equipment.
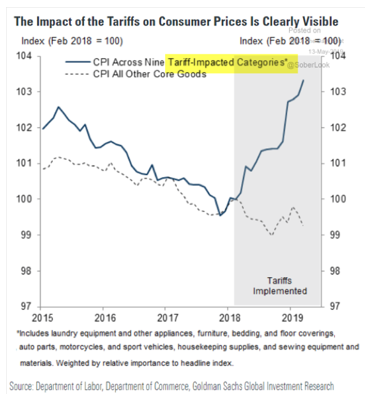
Sources: Department of Commerce, Goldman Sachs, The Wall Street Journal, The Daily Shot – 5/13/19
In the chart above, prices increased by about 3.5% over 16 months before mid-May 2019. As uncertainty in the trade wars grows and earlier cheaper supplies are sold, prices will likely continue to rise. The President has announced new tariffs of 15% on $160 billion of Chinese consumer goods for December 15th if a Phase One deal is not signed. On December 2nd, he announced resuming tariffs on steel and aluminum imports from Argentina and Brazil and 100 % tariffs on $2.4 billion of French goods. The implementation of all these tariffs on top of existing tariffs will only make consumer inflation worse. Tariffs are driving an underlying inflationary trend that is being under-reported by government agencies.
Evidently, the prices for goods and services that consumers experience are vastly different from what the federal government reports and uses to establish cost of living increases for programs like Social Security. So, why is there a disconnect between the government CPI rate of 2.2% and consumer reality of inflation at approximately 5%? The raw data that the Bureau of Labor Statistics (BLS) uses to calculate the CPI rate is not available to the public. When a Forbes reporter asked the BLS why the data was not available to the public the BLS response was companies could ‘compare prices’. This assumption does not make sense as companies can compare prices on the Internet, in stores, or find out from suppliers. The ‘basket of consumer items’ approach was discontinued in the 1980s for a ‘cost of living’ index based on consumer buying behaviors. There was political pressure to keep the inflation rate low. If real inflation figures were reported the government would have to increase payments to Social Security beneficiaries, food stamp recipients, military and Federal Civil Service retirees and survivors, and children on school lunch programs. Over the past 30 years the BLS has changed the calculation at least 20 times, but due to data secrecy there is no way to audit the results. The BLS tracks prices on 80,000 goods and services based on consumer spending patterns, not price changes on goods and services per se. For example, if consumers substitute another item for a higher-priced one it is discontinued in the calculation.
Economist John Williams has calculated inflation rates based upon the pre-1980s basket approach versus the cost of living formula used by BLS today. His findings show a dramatically higher rate of inflation using the 1980s formula.

Source: Shadow Government – 10/2019
His calculation using the earlier basket formula sets the present inflation rate at nearly 10%. Based on our research on various price reporting services, we think the real consumer inflation rate is probably about 5 to 6%.
The implications of this gap between real inflation and reported inflation rates are profound and far-reaching. Federal Reserve complacency about a low inflation rate to justify a low Fed Funds rates is called into question. In fact the economic reality of today is we are living in a 3.25% ‘de facto’ negative interest rate environment where the ten year Treasury bond rate is 1.75%, and inflation is 5%. The liquidity pumping into the economy, based in part on low inflation, is overheating risk assets while providing support for corporate executives to take on debt at decade record levels.
Building the economic framework on erroneous inflation data versus the reality for consumers and businesses lead to massive financial dislocations. This economic bubble is unsustainable and will require a brutal recession to rebalance the economy. As part of a possible soft ‘landing’ policy, the BLS could make price data available to all economists. Full data access will provide an opportunity for objective comments and feedback based on other consumer price research.
The Fed actually focuses on the even lower Personal Consumption Expenditure rate of 1.6% reported by the Bureau of Economic Analysis for October. The Fed prefers the PCE rate because a consumer survey technique is used, while economists prefer the CPI, which is more granular so it is easier to identify goods and services categories that are driving inflation. Using unrealistically low inflation assumptions leads to misguided policy decisions and perpetuation of the myth that inflation is under control. Yet, in fact inflation it is out of control due to extremely low Fed interest rates, liquidity injections, and trade war tariffs.
Tyler Durden
Fri, 12/06/2019 – 12:50
![]()
Zero Hedge’s mission is to widen the scope of financial, economic and political information available to the professional investing public, to skeptically examine and, where necessary, attack the flaccid institution that financial journalism has become, to liberate oppressed knowledge, to provide analysis uninhibited by political constraint and to facilitate information’s unending quest for freedom. Visit https://www.zerohedge.com