
Number-Crunching The Polls Points To Big Tory Win In UK Election
Authored by Mike Shedlock via MishTalk,
An average of the last six polls suggests a Tory majority of 46 according to Electoral Calculus.

Martin Baxter’s Electoral Calculus Model estimates a Tory majority of 46 based on opinion polls from 02 Dec 2019 to 07 Dec 2019, sampling 10,827 people.
Polls Used
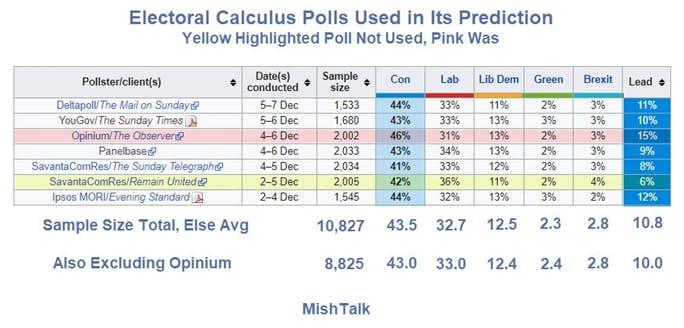
I arrive at 10,827 by discarding the Savanta ComRes poll highlighted in yellow.
Baxter did not discard that poll out of bias but rather because there were two overlapping polls by the same pollster and he used the most recent one.
I calculated the averages excluding Opinium because Opinium looks silly in relation to everything else. The net effect is to toss the highest and lowest and keep average the rest. This is a frequently used method to discard outliers.
Multi-Level Regression and Poststratification
Electoral Calculus (EC) uses Multi-Level Regression and Poststratification (MRP) in its calculations.
YouGov is the only other place that does the same.
EC does not conduct polls but it does uses data from questions pollsters ask in its analysis.
New Polling Technology
EC explains further in New Polling Technology
Electoral Calculus has built its own version of the political regression methodology. This is very similar in spirit to the YouGov approach, though some of technical details may be different, since YouGov have not published a detailed technical description. The basic idea is relatively new to political science, but is already well established in the fields of mathematical statistics and technology. Political scientists use the tongue-wrenching name of “multi-level regression and post-stratification”, but the technology companies prefer the more inviting terms of “machine learning” and “big data”. Unassuming mathematicians just call it “regression”. Whatever it is called, it is the same basic thing. Let’s call it regression for now.
The regression works by taking a set of people and polling them to ask not just about their voting intention but also about other facts about themselves. These facts, which are known as “predictors”, can include demographic characteristics such as age, gender, location, and education as well as political characteristics like their votes in previous elections and the political alignment of their constituency. So far, this is just like conventional polling.
But the next stage is different. Now we “regress” people’s voting intention against their predictor variables. In other words, we estimate the statistical relationship between the various predictor variables and someone’s voting intention. For example, we might find that younger people are more likely to vote Labour and Green and that older people are more likely to vote Conservative and UKIP. Or that someone in the East Midlands is more likely to vote Conservative than a similar person in London. These links are usually not surprising, but the important thing is that we can quantify each relationship in numerical terms.
Finally the regression data are applied to everyone in each constituency to estimate the individual probability that a particular person supports each party. This gives an idea of how many people in each constituency support each party, from which we can work out which party is likely to win that seat.
2017 Results – Actual vs YouGov vs Electoral Calculus
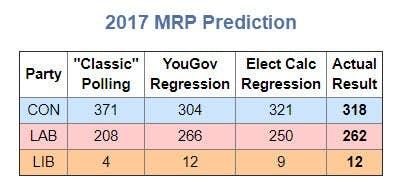
I am convinced that Baxter and YouGov are more likely to have things correct than other pollsters. But I also take Survation very seriously as they were also on the mark in 2017.
Electoral Calculus Predict Election
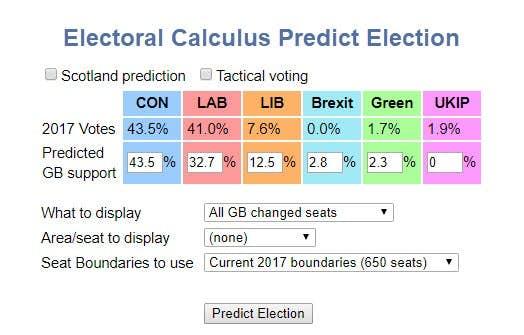
If you plug my “Polls Used” line into the Electoral Calculus Predict Election Calculator it will indeed return the chart I showed at the top.
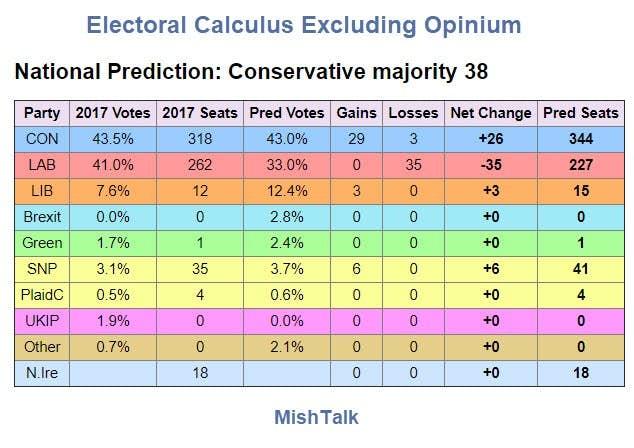
Electoral Calculus Result Excluding Opinium
Electoral Calculus Survation Model
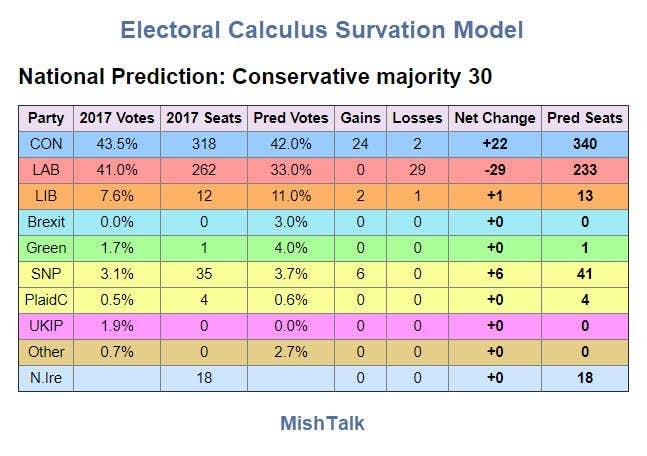
If you like the MRP model but believe Survation is the most accurate pollster you arrive at a Tory 30 seat majority.
What If?
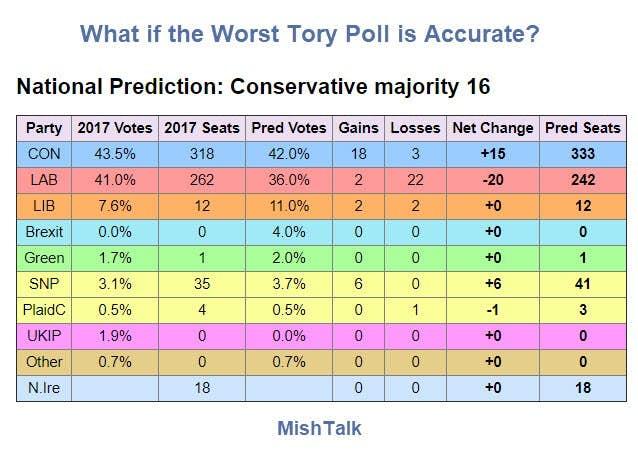
Assume the ComResDec 2-5 poll with a 6.0% Tory Lead is accurate.
EC still expects a Tory majority, not a hung parliament.
Seat By Seat Projections
Electoral Calculus offers Seat-by-Seat Change Projections.

Labour a Complete Loser
EC currently projects Labour is a complete loser, not winning a single seat from anyone.
YouGov Projections
YouGov has a Seat-by-Seat Model that projects a whopping 359 seats for the Tories. However, that model is hopelessly out of date. All the data is prior to Nov 27.
I have a contact at YouGov and emailed him today asking when this projection will be updated.
Tyler Durden
Tue, 12/10/2019 – 03:30
![]()
Zero Hedge’s mission is to widen the scope of financial, economic and political information available to the professional investing public, to skeptically examine and, where necessary, attack the flaccid institution that financial journalism has become, to liberate oppressed knowledge, to provide analysis uninhibited by political constraint and to facilitate information’s unending quest for freedom. Visit https://www.zerohedge.com