2019 Remembered: US Population Growth Tanks, Federal Debt Explodes, & Assets Rocket Higher
Authored by Chris Hamilton via Econimica blog,
2019 was another “rung” in the ongoing bull market. The trifecta of a resumption of QE, interest rate cuts, and a flood of federal debt coupled with ongoing stock buybacks and corporate tax cuts all fueled an asset explosion.
But the Census Bureau was kind enough to release their 2019 data (HERE), and it was simply as divergent to the positive market data as could be. I could only find once in US history that total US population grew at such a low rate (below 0.5%) and that was due to the 1918-1919 global influenza pandemic (Spanish Flu) which in the aftermath of WWI killed between 20 and 40 million globally and nearly 700,000 Americans. This was almost ten times those Americans that perished in the war to end all wars.
The reality is the lower organic population growth (and resultant consumer growth) goes, the greater synthetic substitutes are employed.
Why all the debt?
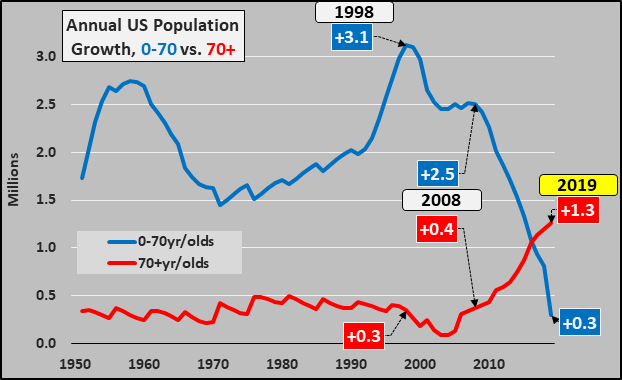
The chart below should be the chart of the year except the US picture is relatively “better” than most advanced nations. It is the ongoing collapse in US population growth among the under 70 year-old population versus surging 70+ year-olds. The Census detailed that total 2019 population growth fell to just 1.55 million and this was due to ongoing declining total births and collapsing net immigration (much to due with stronger border enforcement). 2008 was the precipice and under 70 year-old population growth has been tumbling ever since. As a reminder, it is the 0-70 year-olds that make up 90%+ of the work force, that undertake 90%+ of the credit, and it is they that drive the increase in the money supply in our fractional reserve banking system. When their growth is minimal, the deleveraging of the fast growing elderly essentially destroys currency causing a cascade of deflation. Only via pure monetization underway now can central banks delay the overwhelming tide of deflation and asset collapse.
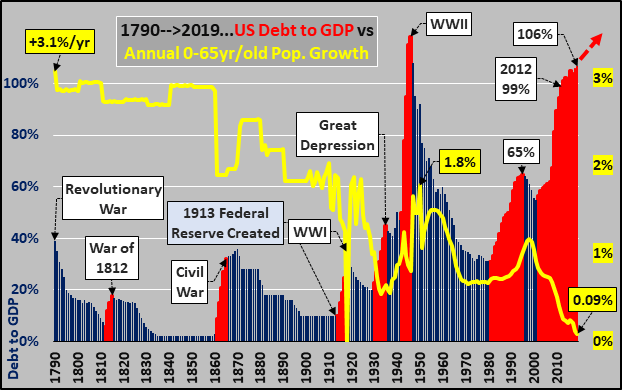
As I discussed in the onset, the chart below details the annual percentage growth of the under 65 year old population (yellow line) versus the debt to GDP ratio with periods of significant debt increases in red columns and debt to GDP declines in blue columns. The severity of the population decline due to the Spanish flu in 1918-1919 was not just the deaths, but the majority of deaths were among the 15-35 year old population. Only now, a hundred year later, is the US revisiting what is essentially zero growth but rather than due to a pandemic, this time the situation is structural rather than accidental.
How much debt?
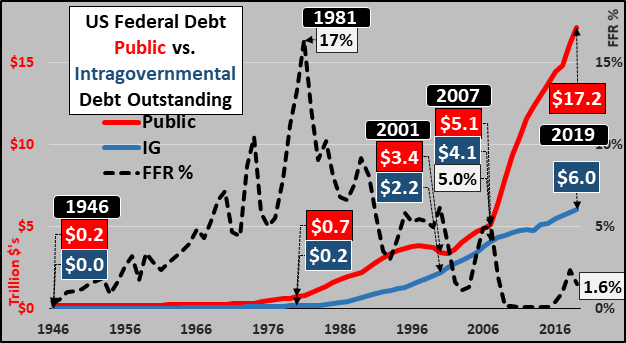
In order to see how 2019 fits into the bigger picture, I pull back to show US federal debt (split between public debt versus intragovernmental trust funds) and the federal funds rate. The $12+ trillion in net additional public debt issued since 2007 is only set to pick up pace as federal spending rises, taxation continues declining, and unfunded liabilities metastasize.
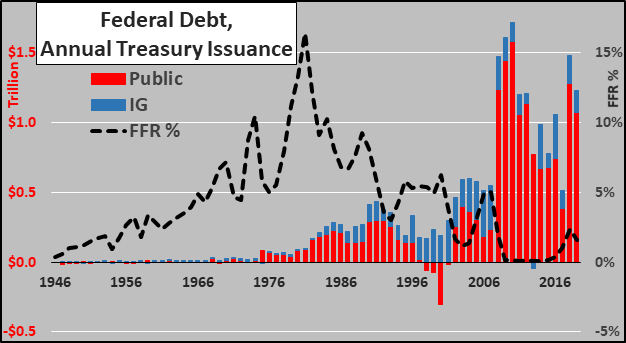
Viewing the same but breaking out annual federal debt split between the change in public and intragovernmental debt versus the federal funds rate. Both charts highlight the shift from Social Security and like IG trust funds (mandated to buy US debt with “surplus” funds) to Public (and pretty much solely the US Public as foreigners have ceased net buying). The Treasury Bulletin makes the lack of natural foreign or domestic buyers crystal clear
Who bought all the debt?
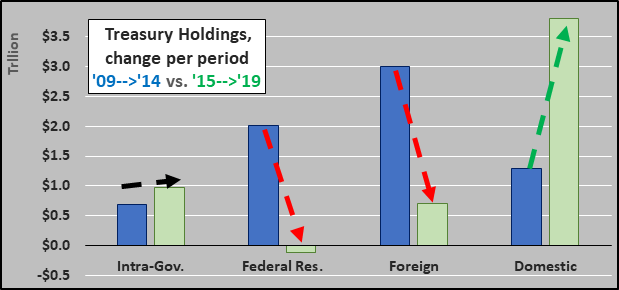
Below, comparing the increase in Treasury holdings over the 2009 through 2014 versus 2015 through 2019 periods, the divergence is again clear thanks to Treasury Bulletin reports (HERE). The Federal Reserve and foreign buyers carried 70% of the new issuance from ’09 through ’14, while domestic buyers took down over 70% since QE 3’s end. Since QE3 ended, that is supposedly nearly $4 trillion in low yielding US Treasury debt that domestic sources bought instead of stocks, or real estate, etc. Dubious is the word I would use to describe the likelihood of non-manipulated record asset prices in stocks, bonds, and real estate while supposedly simultaneously domestic sources poured $4 trillion into low yielding bonds?!?
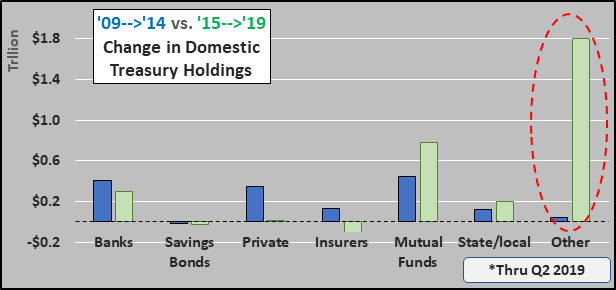
And detailing the change among the domestic sources over the same periods as above. According to the Treasury, we can only really say who it isn’t. Not banks, not savings bonds, not private buyers, not insurers, not state / local buying…it continues to be “other investors” (individuals, GSE’s, corporates/non-corporate business’, & brokers/dealers). Again, the credibility of domestic investors have trillions available to plow into low yielding Treasuries while simultaneously also driving stocks, etc. should be laughable. I have no evidence who did buy all that debt, only a long list of who didn’t.
Debt & Employment
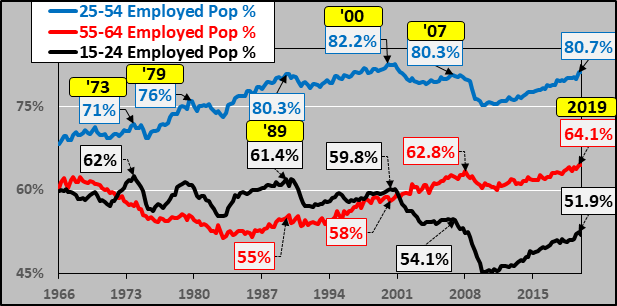
With minimal present and future working age population growth, the fact that the US is at historically full employment should be of great concern. With so few additional persons entering the potential workforce and nearly all those capable and willing already working…there is little further employment growth possible…and without that there is little to no further growth in consumers, home buyers, etc.. Throw all the debt and QE you want at this to get the existing population to consume more, but without further bodies available to work and consumer more…the party is over.
Debt and Population Growth
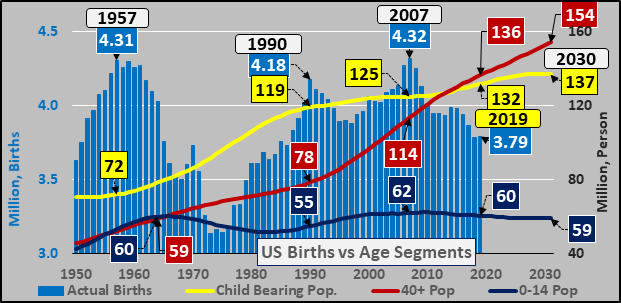
Looking at annual births (blue columns below) versus changing age segments of the US population. The yellow line is the 15 to 40 year-old childbearing population and estimated to rise some five million through 2030…but as I showed above, the anticipated population streams of growth have been lost and thanks to tanking births and immigration, the childbearing population is unlikely to grow much…and with ongoing falling births, soon the childbearing population will be in decline. From there a declining childbearing population with negative birth rates leads to a likely rapid decline in births.
Debt in Perspective
Some attempt to detail the lunacy of the debt creation against a fixed asset like gold, but to wrap this up I show annual US births (inclusive of all the millions of immigrants both legal and illegal) versus US federal debt.
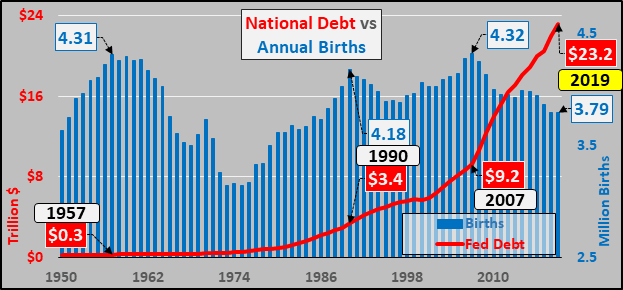
And dividing all that rising debt versus the annual quantity of newborns reveals a pretty unpleasant picture…the elderly saddling the youth with unrepayable debt to maintain a lifestyle that is utterly unrealistic and unachievable except via generational theft. Not the kindest of parting gifts.

Plus, I got last place in my college football bowl pool…again. Unbelievable. There’s always next year. Anyway, happy 2020 and fight the good fight.
Tyler Durden
Sun, 01/05/2020 – 11:30
![]()
Zero Hedge’s mission is to widen the scope of financial, economic and political information available to the professional investing public, to skeptically examine and, where necessary, attack the flaccid institution that financial journalism has become, to liberate oppressed knowledge, to provide analysis uninhibited by political constraint and to facilitate information’s unending quest for freedom. Visit https://www.zerohedge.com