6 Signs That The Market Top Has Arrived
While he clearly did not factor in for the slight possibility that Armageddon may have started when an unknown connoisseur ate bat soup in Wuhan, confirming that a black bat was more unpredictable than a black swan…

… Bank of America’s Michael Hartnett is starting to look at the exit signs.
Having been correct in his late-2019 prediction that the market meltup will take the S&P500 to 3,333 (however not by March 3, but rather mid-January), Hartnett summarizes the current sentiment as follows: sell-side all “melt-up bullish”, buy-side all “it’s a bit toppy” and notes that as his former bullishness is fades, he “would buy puts as SPX approaches 3,500 (PE 20x).”
To help guide BofA clients through his reasoning, here are six signals that will show when the market is topping in 2020:
-
Peak Positioning: Bull & Bear Indicator contrarian “sell” signal (>8) requires ongoing +$5bn EM/HY weekly inflows & big underperformance of US treasuries vs. HY bonds; note “sell” signals since 2002…hit ratio 12/12, median global equity peak-to-trough drop following 3 months = 9.0%; IG corp outperform global equities 7.6%; govt bonds outperform HY corp 3.5%.
-
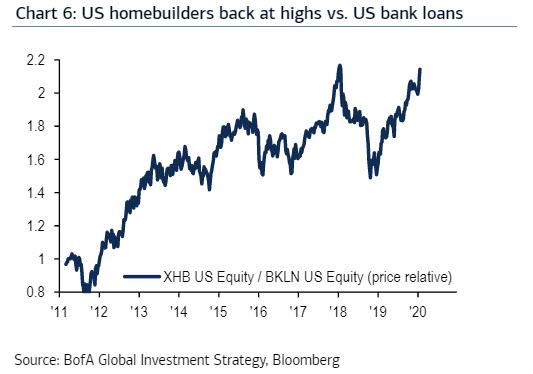
Peak Liquidity: we calculate global central banks set to expand balance sheets by $715bn in 2020, with liquidity growth set to peak at 5.5% YoY ($879bn) in Sept’20; Fed liquidity will trail off from H2’19 $360bn, to H1’20 $133bn, and H2’20 $93bn; opportunities for Fed to signal end of liquidity spigot are FOMC Jan 29th, Humphrey-Hawkins Feb/Mar, FOMC Mar 17th; if Fed signals “Carry On Liquidity” next week then irrational bullish phase continues in Q1; watch for reversals in QE winners vs. QE losers to signal peak liquidity expectations e.g. homebuilders (XHB) vs. bank loans (BKLN – Chart 6), or private equity (PSP) vs. banks (BKX).
-
SOX 2020 in 2020: semiconductor index 22% >200dma…at peak SOX in years ’02, ’03, ’09, ’11, ’16 & ’17, average overbought level of SOX was 27% above 200dma, that’s index level of 2,006 today; SOX at 2020 in 2020 should be peak unless true bubble (TMT bubble peak SOX was 111% above 200dma, i.e. > 3,000 today).
-
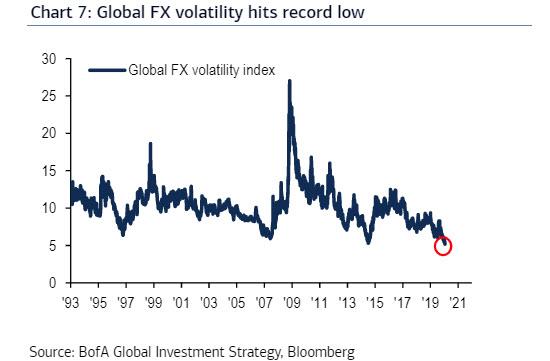
FX volatility: hallmark of bubble is rising prices and rising volatility (see VIX in 1999, a classic example); in 2020, credit & equity bulls should watch cross-asset vol, particularly FX volatility currently at all-time low (Chart 7); “currencies never lie” so a quick bout of FX volatility, most obviously via much-loved EM, would be risk-off signal.
-
Bubbly bonds: since Fed QE4 began in response to repo event in Sept 17th, bond funds inflows have soared $182bn (of which $151bn into IG/HY/EM bond funds); should price momentum rollover in bond ETFs that have been huge inflow winners in past five months (VCIT, HYG, EMB, IEAC) good harbinger of peak risk assets.
-
New lows in bond yields: all the equity relatives (SPW/SPX, value/growth, US/Europe, defensives/cyclicals) show equities discounting new lows in government bond yields; reality of new lows in bond yields, and deflationary breakout of bond yield range sparks profit-taking; and should bond yields fail to break to new lows, this presents optimal 2020 entry point for investors wishing to add TIPs, EAFE, value stocks & cyclicals to portfolios.
Tyler Durden
Fri, 01/24/2020 – 15:35
![]()
Zero Hedge’s mission is to widen the scope of financial, economic and political information available to the professional investing public, to skeptically examine and, where necessary, attack the flaccid institution that financial journalism has become, to liberate oppressed knowledge, to provide analysis uninhibited by political constraint and to facilitate information’s unending quest for freedom. Visit https://www.zerohedge.com