The “Risk Parity-Negative Gamma-CTA” Feedback Loop
Authored by Ryan Fitzmaurice of Rabobank
Summary
- So far 2020 is off to a volatile start with out-sized moves observed across asset-classes.
- Many, if not all, of today’s prominent strategies utilize a volatility-adjusted position sizing method of some sort
- Markets have been suffering from feedback loops as volatility driven portfolio rebalancing triggers CTA trend and momentum signals as well as “negative gamma” from swaps dealers
So far 2020 is off to a volatile start for all asset-classes as virus contagion fears and global growth concerns have led to out-sized market moves. The spike in volatility has had serious implications for speculative flows across markets given the highly systematic trading regime we are in. Many, if not all, of today’s prominent strategies utilize a volatility-adjusted position sizing method of some sort. The thought being that to maintain a pre-determined portfolio volatility target, regular rebalancing of individual position sizes in conjunction with changes in market volatility is necessary. So given the heightened volatility we have witnessed, funds and asset managers have reacted accordingly by slashing position sizing across risk-assets which has unintentionally triggered selling from CTAs and Managed Futures programs as momentum and trend signals turn “bearish” on the back of the volatility inspired selling pressure.
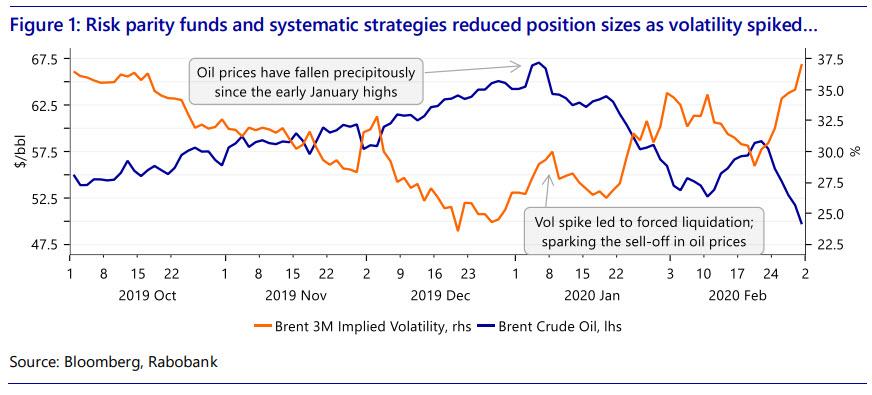
Crude oil is a classic example of this dynamic and was one of the first markets to be impacted by the sell-off in risk-assets. In fact, oil started the year on a very firm note with Brent crude trading above $70/bbl in early January as news of the US strike on Iranian General Soleimani in Baghdad hit the wires. Unsurprisingly, oil spiked higher on the news, as is generally the case when tensions flare in the Middle East, however, that early spike marked the high point for the year so far and prices have been falling precipitously ever since. Many analysts and traders attributed the sharp reversal to a quick de-escalation in tensions between the two long-time foes but to our minds it was more a function of risk parity funds and systematic strategies, who were big “longs” at the time, being forced to liquidate due to the spike in volatility. The selling in oil then snowballed as China went into full-lockdown and further risk-off trades were initiated, leading CTAs to flip from an out-sized “long” position to a sizable “short” position, which is where they currently sit.
“Risk-off” mode
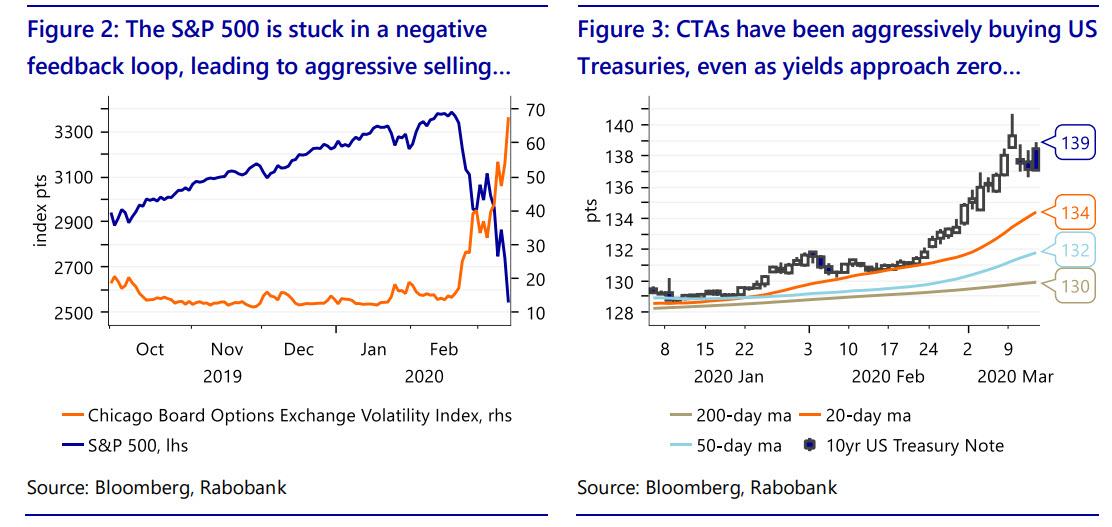
Global equity markets have experienced some sharp down-turns in recent weeks as traders and investors scramble to price in the economic impact of the coronavirus outbreak in China and beyond. Up until mid-to-late February, equity markets had mostly shrugged off the virus concerns that first arose in January, and many indices even rallied to all-time highs in February before panic hit and volatility spiked, initiating the same feedback loop that we saw impact crude oil markets.
Initially, risk-parity funds and systematic strategies, who held sizable “long” positions in February, were forced to sell holdings as a direct result of the sharp increase in the VIX that led to volatility-driven portfolio rebalancing. This dynamic was then amplified by swap dealer “negative gamma” positions, as many banks were short “puts” below the market which are now “in the money”. This combination of forces has led to wild swings as market makers are forced to sell into weakness and buy into strength to maintain a delta-neutral portfolio. Like crude oil, this forced selling ultimately snowballed and has very rapidly flipped many of the prevalent CTA trend and momentum signals from “long” to “short”. The aggressive selling has added to market volatility as bids continue to back up as natural buyers disappear.
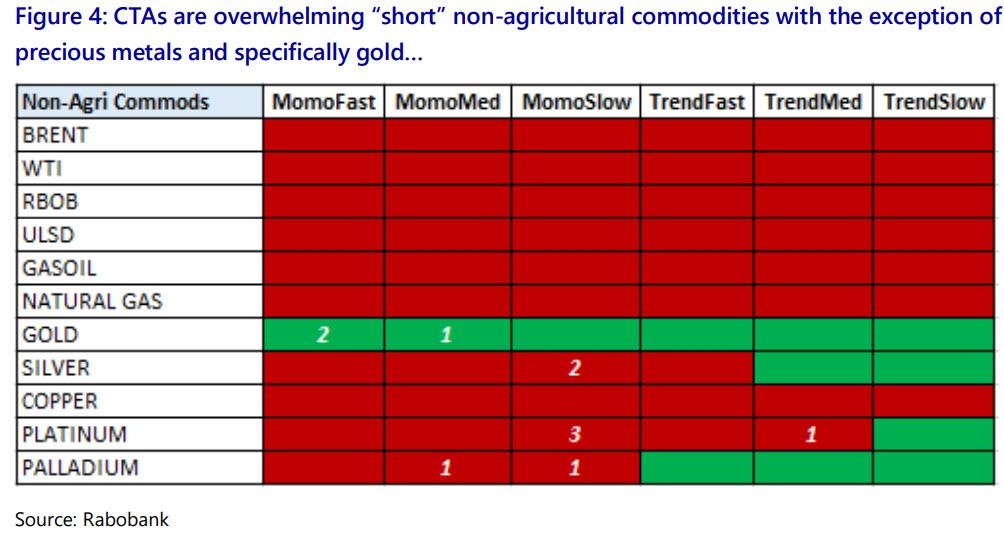
The risk-off trade has also led to a “flight to safety” as investors aggressively pile into treasury bonds, a traditional safe-haven asset class. In fact, the 10 year US treasury yield fell to a new all-time low of just .3137 % in recent days. The sharp move higher has triggered a number of momentum and trend signals which has led to significant CTA buying, even as US yields approach zero. Needless to say, volatility across asset classes remains elevated as a result of the sharp virus-driven moves, albeit from a very low base. We fully expect market volatility to remain elevated in this environment and as systematic market flows shift into and out of asset classes.
CTA Positioning
Commodities
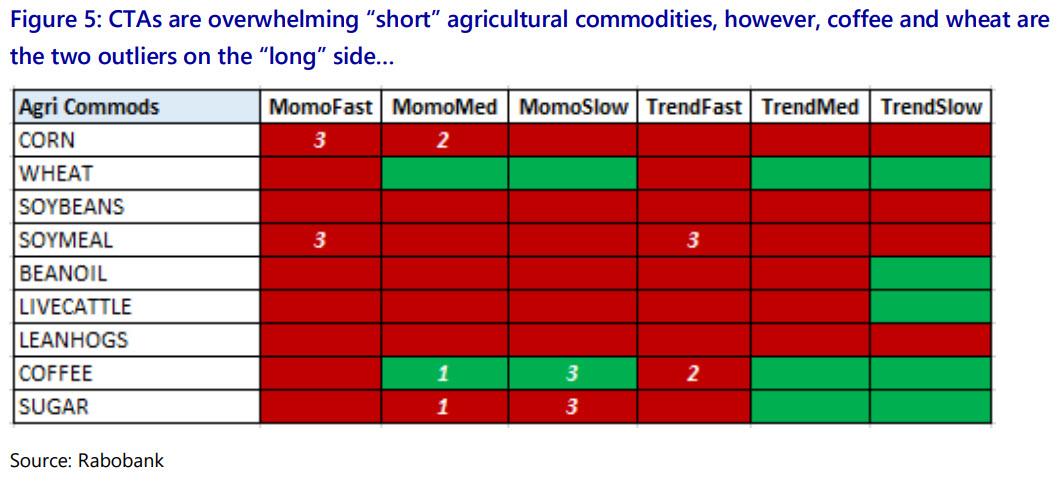
Commodity markets have suffered the brunt of the market impact from the virus contagion as the optimism surrounding Phase One of the US-China trade agreement has given way to fears of a deadly global pandemic. In fact, the diversified Bloomberg Commodity Index is down more than 20% year-to-date with precious metals being the only sub-sector hanging on to any semblance of “bullish” momentum. Energy and agricultural markets have suffered out-sized losses as China remains the key driver of commodity demand growth for those key industries. The moves have been ironic as 2020 was expected to be a strong year for commodities markets given the Phase One trade agreement between the US and China. Nevertheless, CTAs are now heavily “short” commodity markets with the exception of precious metals, although, we see risk that CTAs will start to reduce gold length in the coming days given the potential for short and medium term momentum signals to flip from “long” to “short”, as can be seen in the table below.
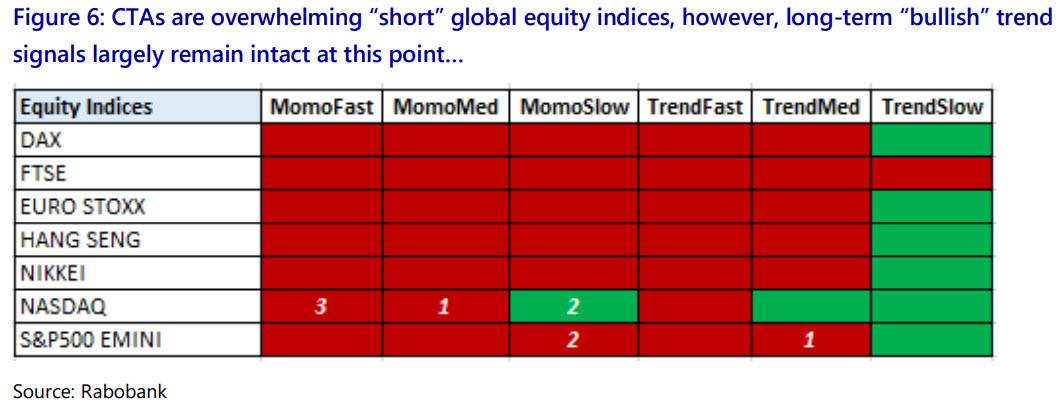
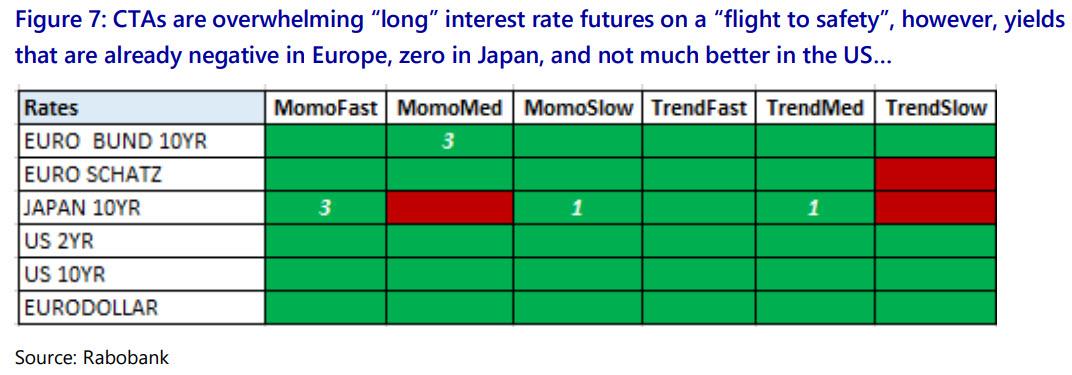
For reference: red = short, green = long, number = the # of days for a potential flip in signal calculated using the Average True Range (only displayed if 3 or less)
- Sell stops: Gold: $1500 USD/oz, $1480 USD/oz
- Buy stops: Silver: $15.30 USD/oz; Platinum: $830 USD/oz; Palladium: $1600 USD/oz, $1540 USD/oz
- Sell stops: Coffee: 103 USd/lb, 97 USd/lb
- Buy stops: Corn: 383 USd/bu, 378 USd/bu; Soymeal: 312 USD/T; Sugar: 12.84 USd/lb, 11.95 USd/lb
Equities
CTAs came into 2020 with across the board “long” positions in global equity indices given the strong performance in 2019 and especially in 4Q19. As noted, global equity markets initially had a delayed reaction to the economic impact of the virus outbreak, however, that has all changed along with the rapidly deteriorating global growth outlook. Losses for the major global indices are quickly stacking up with some down more than 30% in just a couple weeks’ time. Ironically, it’s been Chinese markets that have fared the best this year despite the virus originating there. CTAs are now overwhelming “short” global equity indices as a result of the “bearish” momentum and as indices erase over a years’ worth of gains in short order.
- Sell stops: Nasdaq: 7435 index pts, 8605 index pts
- Buy stops: Nasdaq: 7937 index pts; S&P: 500 2847 index pts
Rates
Interest rate futures started off the year with little optimism given that the US Fed was indicated to be on “pause” with respect to more cuts but also with little to no hope for hikes. This was reflected in the CTA positioning which came into the year mixed with no strong underlying trends in play. This has all changed rapidly, however, and CTAs are now overwhelmingly “long” interest rate futures as the “risk-off” trade has triggered a classic “flight to safety” trade. While the rush into bond futures has paid off thus far, the fact of the matter is CTAs are now extremely “long” yields that are already negative in Europe, zero in Japan, and not much better in the US.
- Sell stops: Euro Bund 10yr: 171.5 points, Japan 10yr: 153 points, 152.25 points
- Buy stops: No imminent stops
Foreign Exchange
Foreign exchange markets were very dull for much of the last year with the sector even registering record low volatility but that that has all suddenly changed and we could be headed for a prolonged period of heightened volatility as we see it. This is also apparent from the mixed CTA positioning currently in play across the FX space and the fact that we are seeing the “herd” begin to reverse direction in some long-held positions such as the bearish Euro trade that has been in place now for some time. As you, can see from the table below, the “short” and “medium” term momentum signals are only two days average “up” days from flipping to “buy” signals.
- Sell stops: US Dollar Index: 97.85; Japanese Yen: 92.67, 92.33
- Buy stops: British Pound: 125.8; Japanese Yen: 94.12; Euro: 112.63, 112.70

Looking Forward
Looking forward we see CTAs fully positioned for further “risk-off” moves given they are net “short” equities and commodities in a meaningful way while holding a sizable “long” position in interest rate futures. In our view, CTA portfolios are at risk of being whipsawed out of their current positions should things begin to improve with respect to the coronavirus and global economic growth, however, the timing of any relief is still a very big unknown. It is worth keeping an eye on the VIX and commodity market volatility levels as risk-parity funds will begin rebuilding “long” positions as volatility falls. This buying pressure could then work to trigger upside “buy-stops” just as it did “sell-stops” on the initial volatility spikes and subsequent price declines. It is also worth noting, that CTAs as a whole have fared quite well through these turbulent markets and have far outperformed the often cited S&P 500 benchmark and especially in recent days as global equity markets have collapsed. Ironically, this outperformance comes after a long period of prolonged outflows from CTA funds as investors became disillusioned with the strategy after years of poor performance, a fact we highlighted in an earlier note “CTA and Managed Futures primer”.

Tyler Durden
Thu, 03/19/2020 – 19:35![]()
Zero Hedge’s mission is to widen the scope of financial, economic and political information available to the professional investing public, to skeptically examine and, where necessary, attack the flaccid institution that financial journalism has become, to liberate oppressed knowledge, to provide analysis uninhibited by political constraint and to facilitate information’s unending quest for freedom. Visit https://www.zerohedge.com