The 1930s Guide To Whether The Rally Can Continue
Submitted by Peter Garnry, Head of Equity Strategy, Saxo Bank
Summary: Yesterday’s close in S&P 500 marked a 17.6% gain in three trading session something we haven’t observed since the 1930s in a testimony to how volatile markets have become during this COVID-19 outbreak. We have looked at previous big moves and what S&P 500 did subsequently. History suggests declines on average in the next two trading sessions after such a big move but then over subsequent six weeks equities offer cumulative returns of up to 6% on average. Over a three-month horizon the outcome range is massive so investors should be careful about taking bold positions. In other words this is a trading environment where active management of positions is crucial.
Yesterday’s close in the S&P 500 Index marked a 17.6% gain in three trading session turning it into the 6th biggest such move since early 1928. With aggressive policy moves and a period of optimism it’s worth pondering where equities will go from here.
Today has so far only offered risk-off for investors with equities down 5% in Europe as the EU Council meeting last night was a total disappointment for Europe as especially Germany and the Netherlands against eurobonds and the leaders could not find common ground on a coordinated fiscal response. This has left the market wondering whether Europe’s recession will be deeper and with the weekend upcoming many traders might be realizing their gains this week.
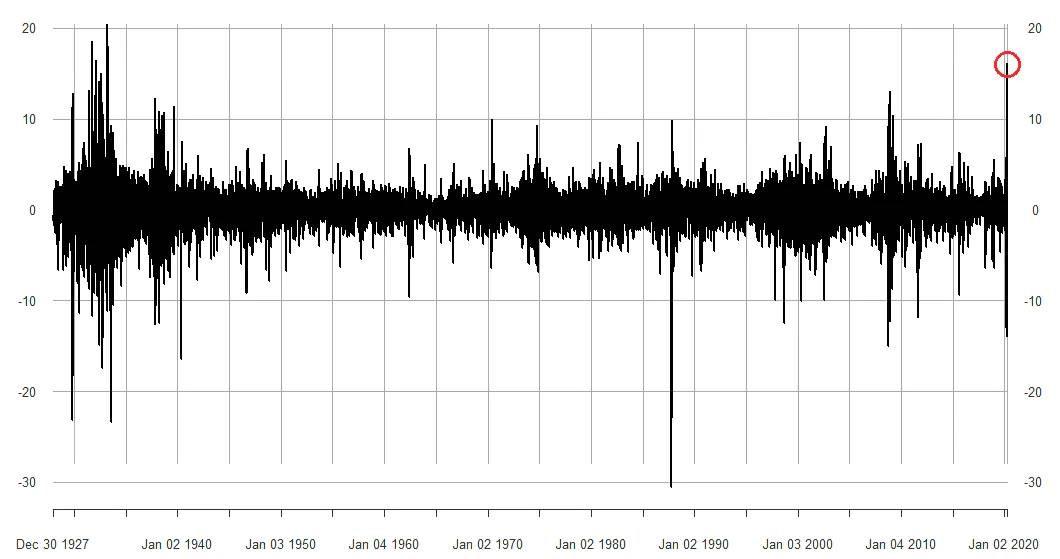
The big upward move in S&P 500 contains information of confidence just as big moves contain information about panic and despair. But is a big move an indication of further gains? To get enough samples to conclude anything we analyzed all future paths in S&P 500 over three months following a 10% gain or more in three trading days. There has been 36 cases of the S&P 500 Index moving this much since early 1928. We find 32 of these observations in the period 1929 to 1939 and the remaining four observations during 2008-2009.

The numbers suggest mean reversion on average, that’s lower equities, in the first two trading days following such a big move up in equities. Six weeks out we observe more path leading to gains and on average 6% gains over six weeks. Over a three month horizon there are as many profitable as unprofitable paths but the distribution of cumulative returns are skewed towards positive returns.
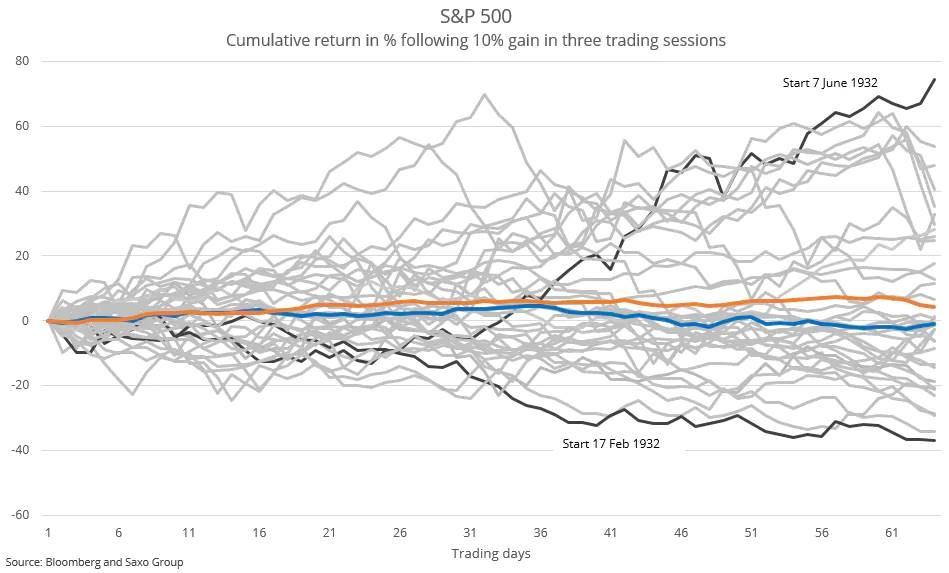
The biggest 63-day trading day return is 74.4% and the biggest negative return is -36.8%. So history is telling investors that such as big move is succeeded by an extreme range in outcomes.
This means that investors that put on long positions here will have to actively manage the position unless they are willing to accept a potential 36% drawdown from yesterday’s close.
Tyler Durden
Fri, 03/27/2020 – 13:05![]()
Zero Hedge’s mission is to widen the scope of financial, economic and political information available to the professional investing public, to skeptically examine and, where necessary, attack the flaccid institution that financial journalism has become, to liberate oppressed knowledge, to provide analysis uninhibited by political constraint and to facilitate information’s unending quest for freedom. Visit https://www.zerohedge.com