
Is Sweden’s COVID-19 Handling A Failure Or A Success?
Authored by Mike Shedlock via MishTalk,
Sweden did not have a hard lockdown like its neighbors although people were advised to work from home when possible. It also banned nursing home visits on April 7.
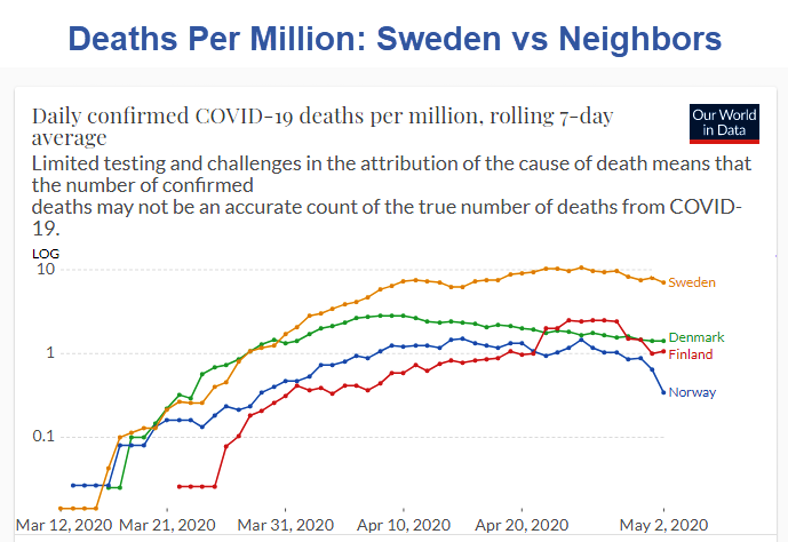
Sweden says its model worked, but Numbers Suggest a Different Story.
Sweden’s Covid-19 deaths per capita are 3 to 6 times its Nordic neighbors.
Nordic Country Restrictions

Sweden vs Nordic Neighbor Deaths
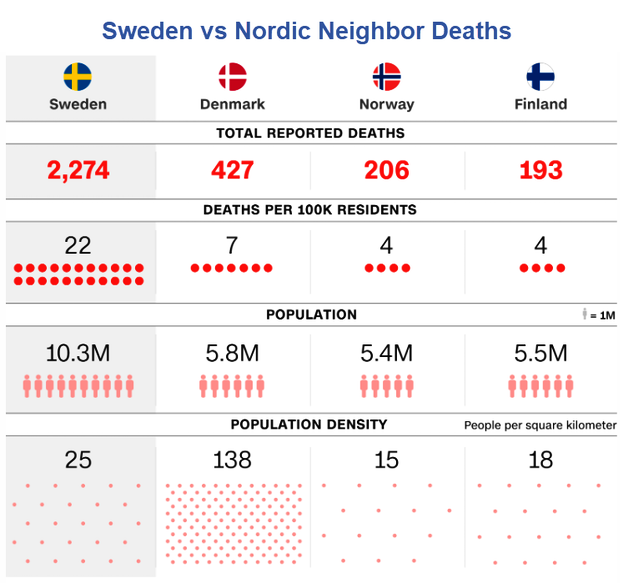
On a per capita basis, Sweden’s Covid-19 deaths are 3 to 5.5 times the other Nordic countries.
Sweden has just over 3 times the death rate of Denmark. But note Denmark’s population density disadvantage of 138:25.
Success or Failure?
Success is in the eyes of the beholder.
A death rate 5.5x is acceptable to some but not others.
But Sweden has a ton of pressure to under-report Covid deaths. I would be shocked if they didn’t.
Regardless, one can easily look at this data, ignore the undercounts (perhaps even factor some in), and conclude Sweden did the right thing.
But how does that translate to the US?
Population Density of NYC
For comparison purposes, the Population Density of New York City is 26,403 people per square mile (10,194/km²), makes it the densest of any American municipality with a population above 100,000.
Manhattan’s population density is 66,940 people per square mile (25,846/km²), highest of any county in the United States
Sweden Not a Good Model
Even if one is happy with Sweden’s results, it is not a representative model for large US cities.
R0 – Infection Transmission
Nate Silver has an Interesting Twitter Thread on R0, the the number of people someone will infect on average, if they catch it.
US daily numbers via @COVID19Tracking:
Newly reported deaths:
Today: 1,651
Yesterday: 1,743
One week ago (4/25): 1,818Newly reported cases:
T: 30K
Y: 34K
4/25: 36KNewly reported tests:
T: 265K
Y: 305K
4/25: 271KPositive test rate:
T: 11%
Y: 11%
4/25: 13%— Nate Silver (@NateSilver538) May 2, 2020
https://platform.twitter.com/widgets.js
Nate Silver Followups
-
The positive test rate, which I believe is a better metric than the raw number of + tests, continues to show slow, incremental improvement. But I do mean *slow*. It’s consistent with a nationwide R of around 0.9, where R>1 means the epidemic is growing & R<1 means it's shrinking.
-
That is a national average, however. There are places like NY where there’s a reasonably steep decline (R of perhaps 0.7-0.8). In turn, there are likely to be other places where infections are still growing (R of perhaps 1.1 to 1.3) and it isn’t just an artifact of more testing.
-
Overall, there isn’t a lot of room for error. A few states have had clear, sustained improvement and may have room in their R “budget” to relax restrictions. But for many others, even slight changes could bring R >1. Or R may be >1 already.
-
That’s not to say it’s necessarily up to policymakers. I don’t care about the state capitol protests, which are an overplayed story. But it’s clear from e.g. mobility data that people are moving around more and abiding less strictly by social distancing.
-
I wish we knew more about what this activity consisted of. Taking a nice, long drive to a non-crowded state park should be pretty safe, for instance. But pressure points seem to be outdoor activity in more crowded spaces, and small-to-medium-sized social gatherings.
Reopening Too Early
At an R0 that’s well below 1, the disease will die out (but perhaps return later in the Autumn or Winter).
Ar R0 of 1, the current results can go on for a long time.
An end to the lockdowns too early could easily send R0 back well above 0.
The latter is what everyone want to avoid.
Tyler Durden
Mon, 05/04/2020 – 05:00![]()
Zero Hedge’s mission is to widen the scope of financial, economic and political information available to the professional investing public, to skeptically examine and, where necessary, attack the flaccid institution that financial journalism has become, to liberate oppressed knowledge, to provide analysis uninhibited by political constraint and to facilitate information’s unending quest for freedom. Visit https://www.zerohedge.com