For 2nd Week Jobless Claims Spiked By Major Data-Entry Error; Real Claims Much Lower Than Reported
Tyler Durden
Thu, 05/21/2020 – 10:45
When we reported the initial claims data last week, one number stood out: the 298,680 initial jobless claims reported by Connecticut, which we speculated may have been a simple error.
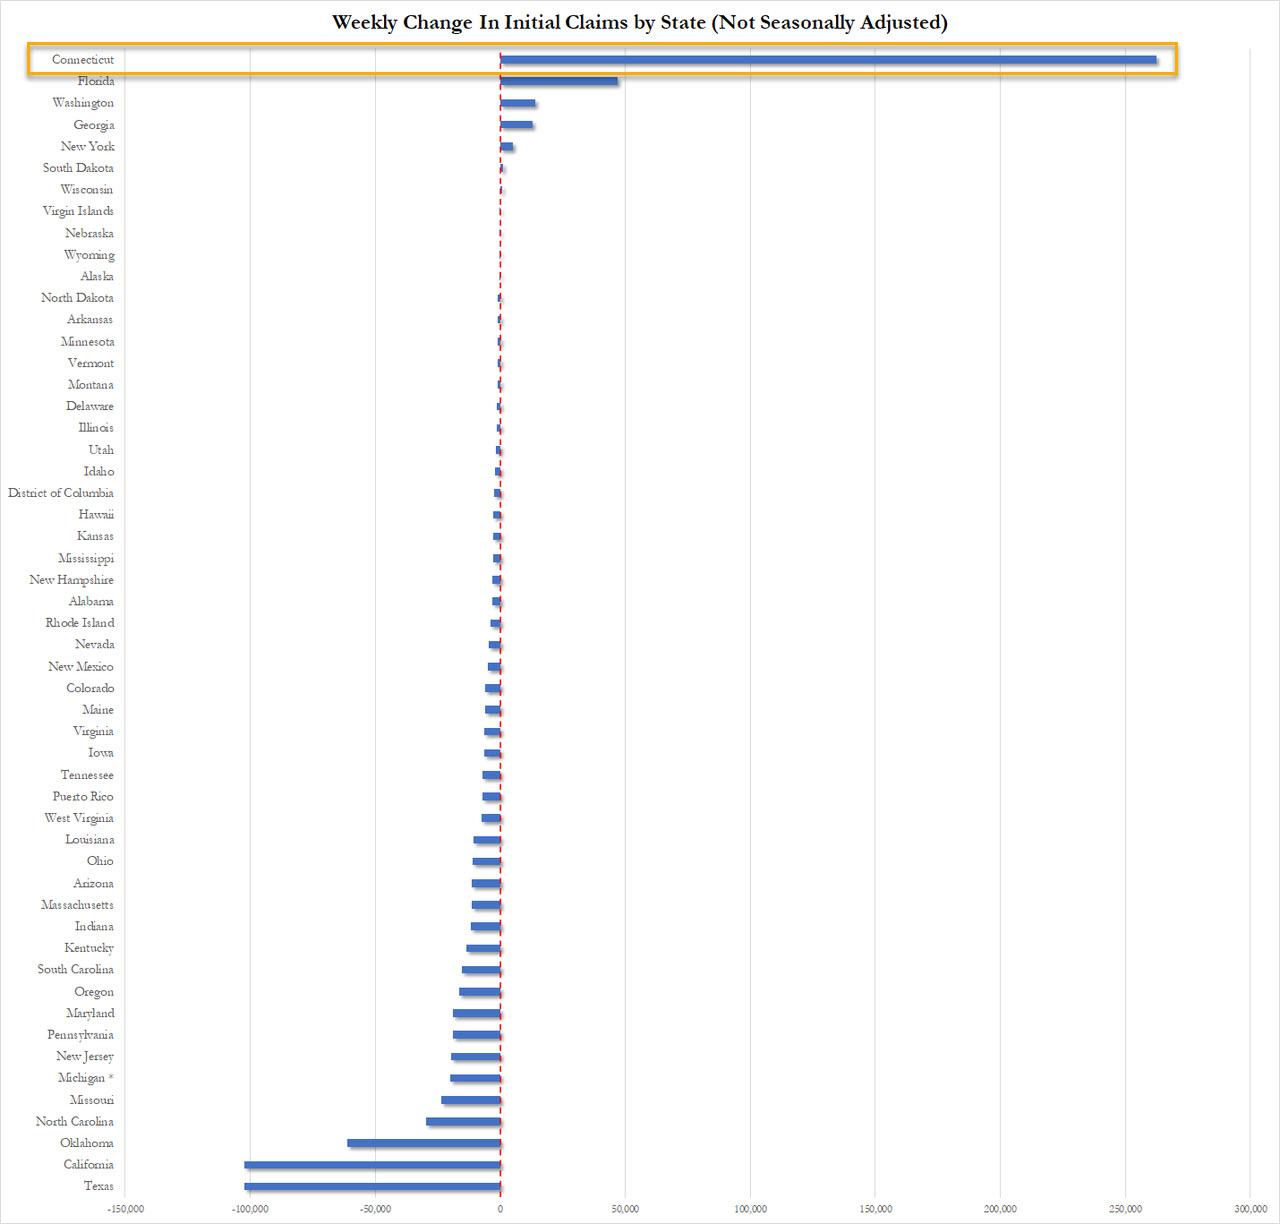
A few hours later,our suspicion was wrong, as Connecticut confirmed of an embarrassing fat finger error, because instead of reporting 298,680 initial jobless claims, the Constitution state meant to type in 29,846.
One week later, after today’s initial claims report which found that over 2.4 million workers were laid off in the past week, there was a second consecutive data error, with the actual level of claims in a federal program 1 million lower than initially reported.
According to a Massachusetts official, the state had 115,952 initial claims last week under the federal Pandemic Unemployment Assistance program, not the 1,184,792 shown in the U.S. Labor Department’s report earlier Thursday. That means the 2.23 million reported figure for nationwide PUA claims was likely about half that number in reality.

And while those figures, as Bloomberg notes, are separate from the principal number tallying initial claims under regular state programs, it still prompts questions if states are gaming the data to represent the worst possible picture for themselves in hopes of getting a state bailout.
Which brings us to a point made by Southbay Research, namely that even ignoring fat fingers, the true jobless claims data is far lower than what is reported.
First, keep in mind that the number of Ongoing Claims is the most important data point to track COVID’s peak economic pain, as it represents the most concurrent data available. Alas, it now appears that the Jobless Claims data has been misreported, whether for political reasons or simply due to statistical error.
As Southbay notes, what we should see at current levels, is that there should be almost no difference between Seasonally Adjusted (SA) and Not Seasonally Adjusted data (NSA). Historically, ongoing Claims run in the 2M~3M range and that figure shifts ~150K per week depending on various seasonal factors. For example, Spring hiring pushes down ongoing claims.
But COVID has created 22M+ Ongoing Claims. Against that background, a shift of 150K jobs is noise.
What actually happened: Ongoing Claims were adjusted 2.2M. Not even close to any historical seasonal shift.
The Methodology Mistake
In the latest release on Unemployment Claims, the Dept. of Labor reported the following
- Ongoing Claims (Seasonally Adjusted): 25.1M
- Ongoing Claims (Not Seasonally Adjusted): 22.9M
- Seasonal Adjustment factor: 9.3%
Compare that to the same week last year:
- Ongoing Claims (Seasonally Adjusted): 1.68M
- Ongoing Claims (Not Seasonally Adjusted): 1.54M
- Seasonal Adjustment factor: 9.1%
See the problem? The model is plugging a multiplier (9%) instead of using the actual historical nominal level. That’s ok in normal conditions when the underlying figure is ~2M. But when the data is an order of magnitude higher at 23M, using a rate makes no sense. And it’s a methodological error that unnecessarily adds 2.2M to the Ongoing Claims count.
The correct approach would be to use the underlying data (hey, this week typically sees a median drop of 200K in ongoing claims, so we should use that figure.
- Use the median actual: 23M Ongoing Claims
- Use the rate: 25M Ongoing Claims
2 million “jobs” due to statistical adjustments is big distortion.
What is notable is that the BLS Nonfarm Payrolls Did it Correctly. Consider the recent Nonfarm Payrolls report for April:
- Nonfarm Payrolls (SA): -20.5M
- Nonfarm Payrolls (NSA): -19.5M
- Delta: -1M
Historically, April payrolls grow ~0.9M (warm weather boosts jobs). To offset that seasonal expansion in jobs, the seasonal adjustment factor reduces the NSA figure by -0.9M. Under normal circumstances, that 0.9M is reduced to a rate and would be applied. But COVID is far from normal conditions. Instead, it would appear that the BLS tossed the rate and went with the core data. But the team responsible for Ongoing Jobless Claims missed this step.
Bottom line: The NSA data shows that not only is the number of claims much lower, but that the US has reached peak ongoing unemployment.
![]()
Zero Hedge’s mission is to widen the scope of financial, economic and political information available to the professional investing public, to skeptically examine and, where necessary, attack the flaccid institution that financial journalism has become, to liberate oppressed knowledge, to provide analysis uninhibited by political constraint and to facilitate information’s unending quest for freedom. Visit https://www.zerohedge.com