How To Hedge An Apple “Blow-Off Top” Melt Up
Tyler Durden
Tue, 08/25/2020 – 12:46
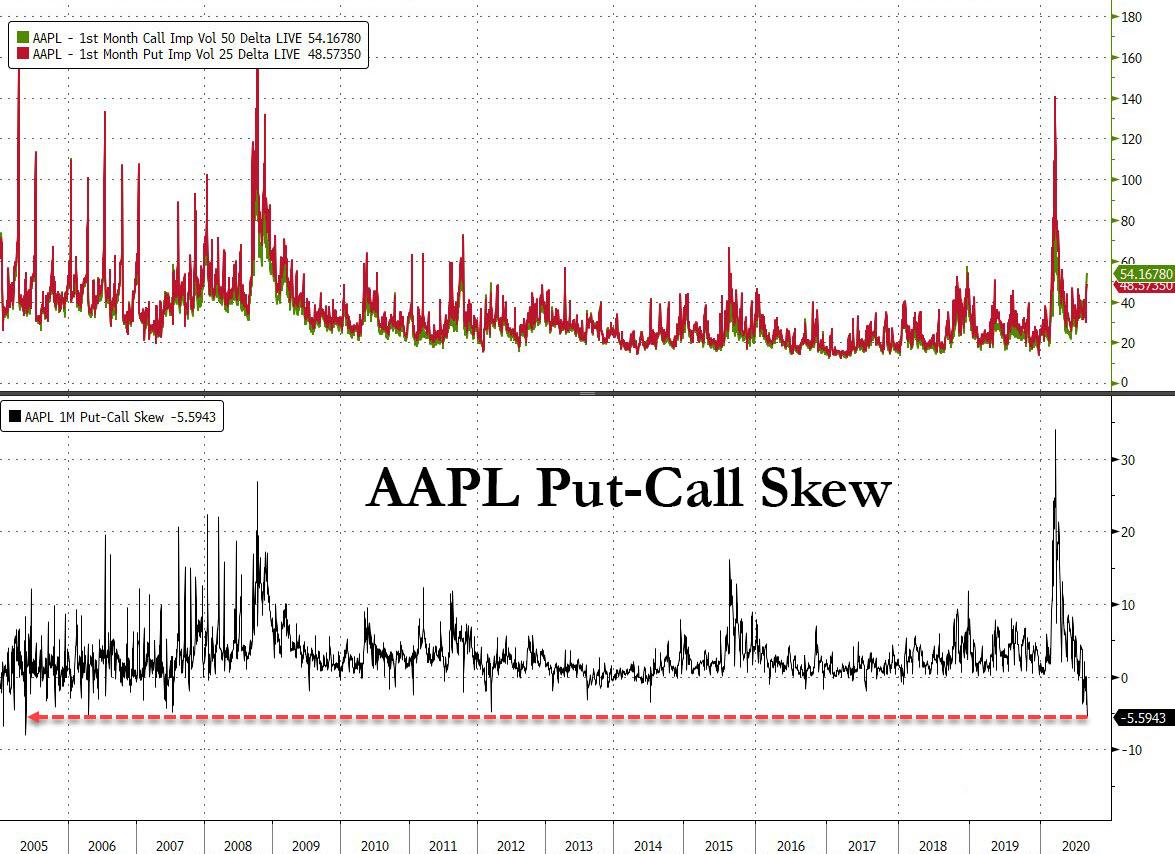
When you have the chief equity strategist of a major US bank, in this case Morgan Stanley’s Michael Wilson, telling you that the “headline indices are now being driven by just one stock, Apple” (for reasons we explained over the weekend), you know it’s bad. Just how bad? Well, as we reported last Friday ahead of Monday’s 4:1 stock split dividend date, AAPL’s market cap had risen by nearly $250BN over just a few days as retail investors flooded the name buying not the actual underlying stock but calls. That, in turn, resulted in AAPL put-call skew turning the most negative in 15 years.
As Goldman explained one month ago, “negative skew is a relatively rare statistic for large cap names such as AMZN (where three month skew is currently at all-time lows), implying crowding in long AMZN calls.” Just replace AMZN with AAPL and you know all there is to know about what is pushing not just AAPL but the entire market higher.
And while AAPL stock is finally down today, sliding back below $500 if still well above $2 trillion in market cap now that Gen-Z daytraders no longer “frontrun” the stock split, how should investors position when the melt up inevitably returns: after all, the bubble is nowhere near close to bursting with the Fed about to announce at either Jackson Hole or in next month’s FOMC meeting that it will officially ignore a burst in inflation as a “budget constraint”, with monetary conditions expected to remain record easy until Americans are boiling in soaring prices.
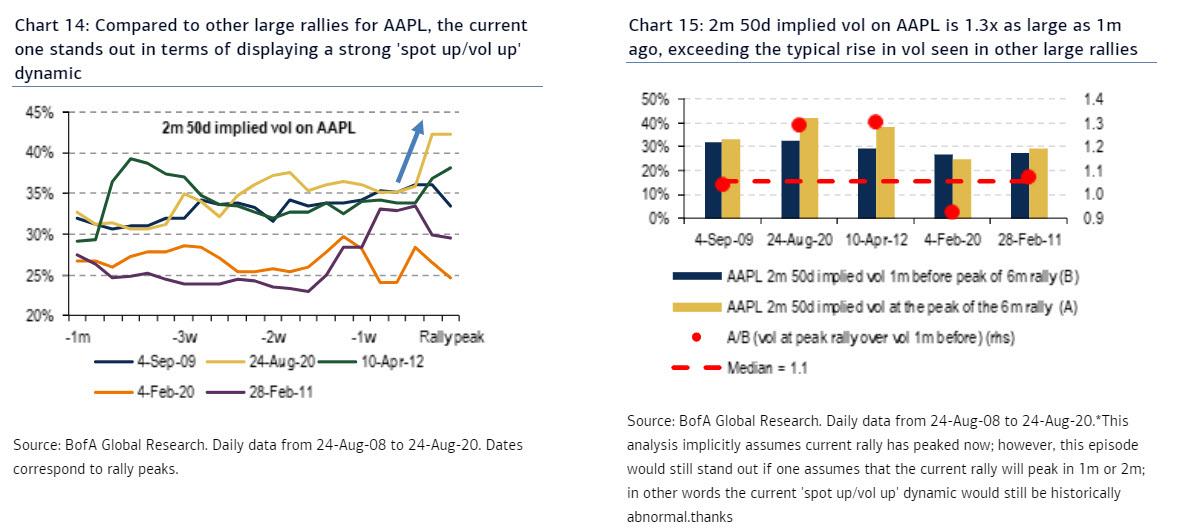
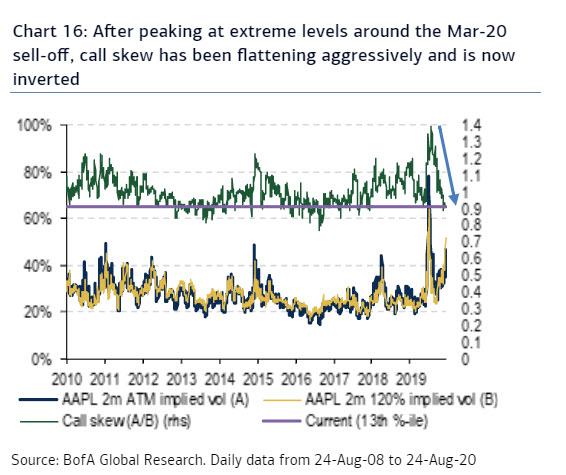
Picking up on the theme of an unprecedented “gamma” in Apple, where the higher the price rises, the more calls are bought, leading to higher prices, more call buying and so on, BofA writes today that the strong rally in Apple “saw an abnormally strong “vol up-spot up” dynamic, that, over the past 10yrs, has almost never before been displayed to the same degree.” Additionally, echoing what we said over the weekend, BofA’s Benajmin Bowler writes that upside vol has risen even faster vs ATM vol-a sign of upside chasing via calls-pushing call skew to historically flat levels. Some more details:
In volatility land, the two most notable dislocations for AAPL have been volatility rising in tandem with the stock price, as well as call skew flattening. Indeed, we recently remarked that both the Nasdaq and most of its largest constituents have been rallying on higher implied vol recently. Looking specifically at AAPL and its largest rallies in any non-overlapping 6m period since Aug-08, Charts 14 and 15 show how AAPL volatility behaved during such episodes. While the “spot up/vol up” dynamic is actually the norm over this sample, the current episode (which qualifies as the 2nd largest rally) stands out as one where this dynamic is most visible, together with the Apr-12 rally. Indeed, 2m 50d implied vol is now 1.3x as large as 1m ago, while on avg. it was only 1.1x as large.
But doesn’t that suggest that the meltup is almost over, and what do comparable historical episodes suggest? Curiously, during the September 09 rally which seems the closest analog, vol 1m before the rally peak was almost identical to where it was one month prior to today (32.0 vs. 32.7 vol pts). However, when the rally peaked in Sep-09, 2m vol stood at 33.4 vol pts, 8.8 vol pts below the current level of 42.2 vol pts.
Meanwhile, as noted above, another dislocation is the extreme flattening of call skew. Indeed, the current 2m ATM vs 120% call skew has been flatter less than 15% of the time over the past 10 years (see chart below), with upside vol now higher than ATM vol (inverted call skew).
* * *
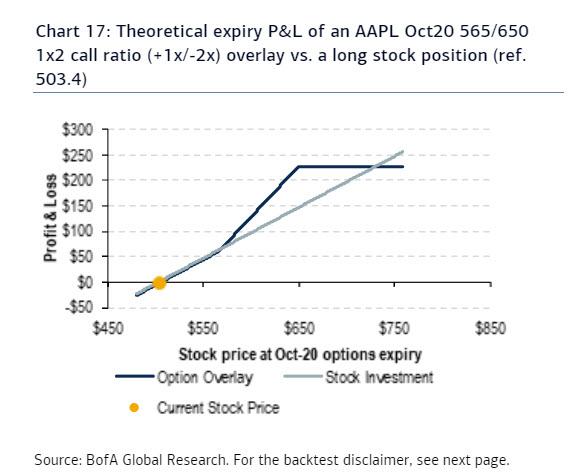
Which brings us back to the original question: how to trade/frontrun a “blow-off top” in Apple? According to BofA, the preferred trade that sets up well given high vol/flat skew is to buy 1×2 call ratios (+1x/-2x) as an overlay to a long stock position. Specifically, buying 1x Oct20 565 call (ref. 503.4) and selling 2x Oct20 650 calls costs 72bps. The next shows the theoretical expiry P&L and compares the options overlay position to a long stock position.
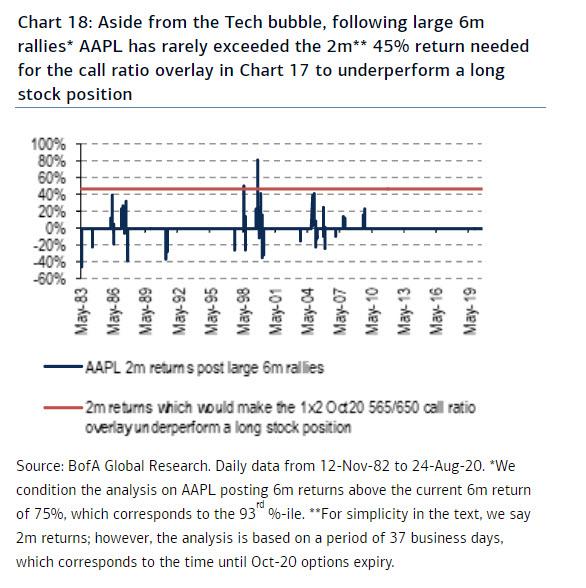
On the upside, the overlay allows to gain accelerated upside up to the short call strike (650). The overlay only starts underperforming the long stock position if AAPL rallies beyond 731 (45% upside from here) which would be an unprecedented performance outside the Tech bubble, given the already strong returns. Conditional on AAPL posting large 6m returns, the subsequent 2m returns have been materially higher than 45% only once in the history of AAPL (in the midst of the Tech bubble as shown in the chart below).
On the downside, the option overlay position underperforms a long stock position by the initial premium amount (72bps).
![]()
Zero Hedge’s mission is to widen the scope of financial, economic and political information available to the professional investing public, to skeptically examine and, where necessary, attack the flaccid institution that financial journalism has become, to liberate oppressed knowledge, to provide analysis uninhibited by political constraint and to facilitate information’s unending quest for freedom. Visit https://www.zerohedge.com
