CTAs Are Approaching A Liquidation Trigger Point As They Sell Treasuries
Tyler Durden
Fri, 10/23/2020 – 12:55
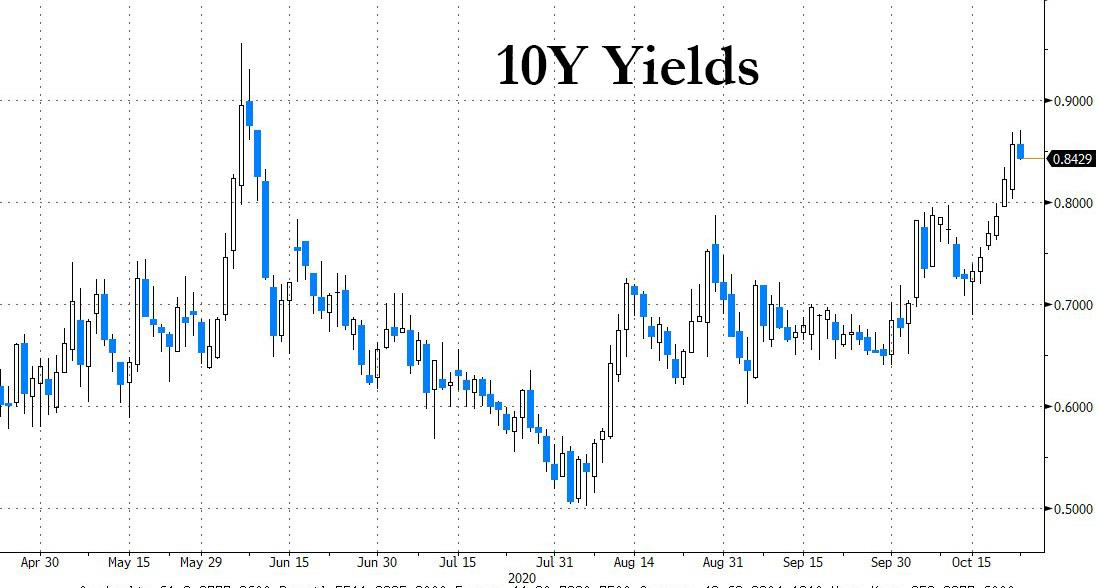
The recent breakout in 10Y yields to the highest level since June…
… accompanied by the “triple top” in the 2s10s which hints at an imminent breaking out curve steepening…
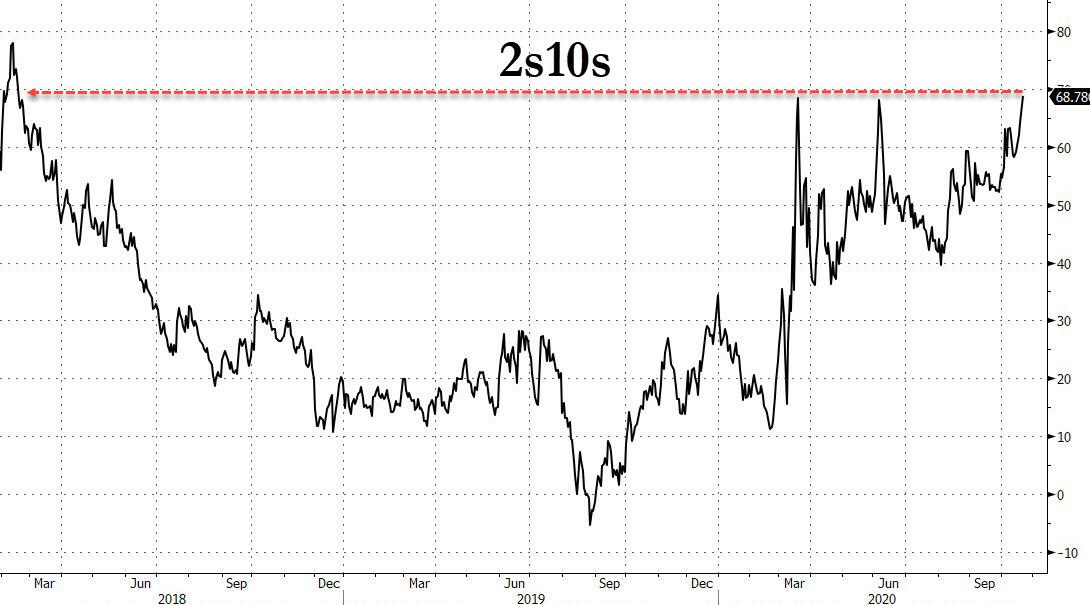
… has prompted questions what is behind the recent puke in rates.
One answer comes from Nomura’s quant Masanari Takada who writes that in bond markets,
- global macro hedge funds have started unwinding long positions in UST futures
- CTAs have responded by stepping up the pace of their exits from long positions in 10yr UST futures (TY).
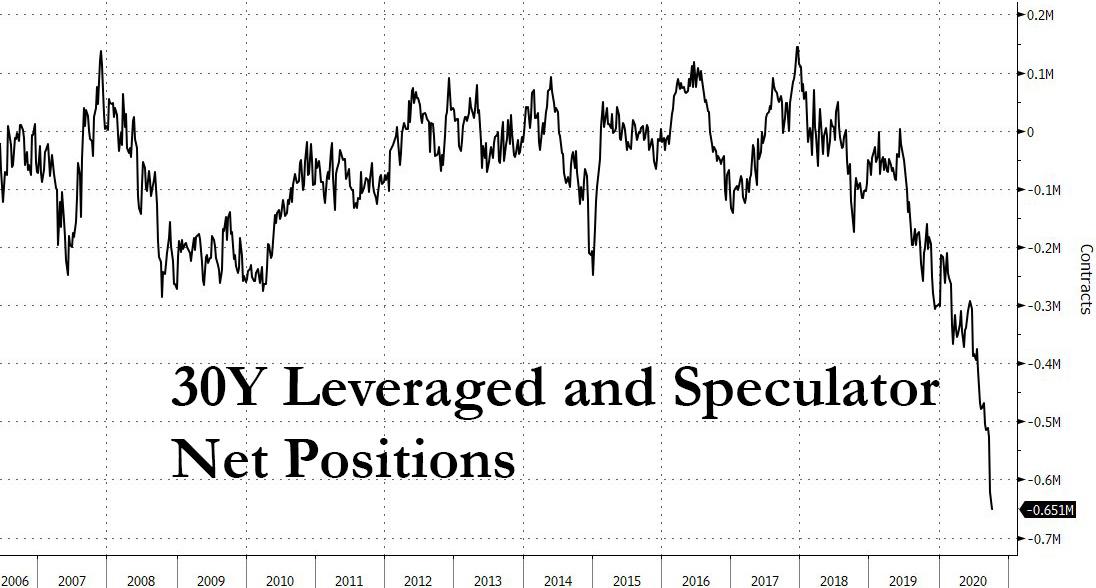
According to the Japanese strategist, the turnabout in the direction of global macro hedge funds’ trades in the US bond market “is especially significant in that it suggests that expectations for a decline in UST yields over the next three months or so have faded”, despite what we showed recently is a record net short position in 30Y futures across traders.
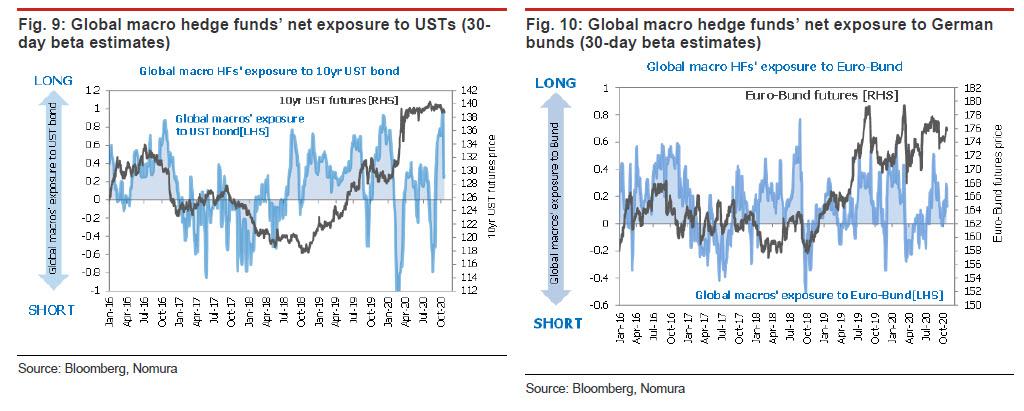
Drilling down, Nomura writes that according to its 30-day beta estimates, global macro hedge funds’ net long exposure to USTs has plainly peaked and dropped back, as the 10yr UST yield jumped to a high of 0.87% this week. According to this, Takada writes, “it seems likely that global macro hedge funds and other such short-term, top-down investors are unloading long positions in USTs that they accumulated in September. Incidentally, global macro hedge funds are generally moving further to the long side in their exposure to European government bonds.”
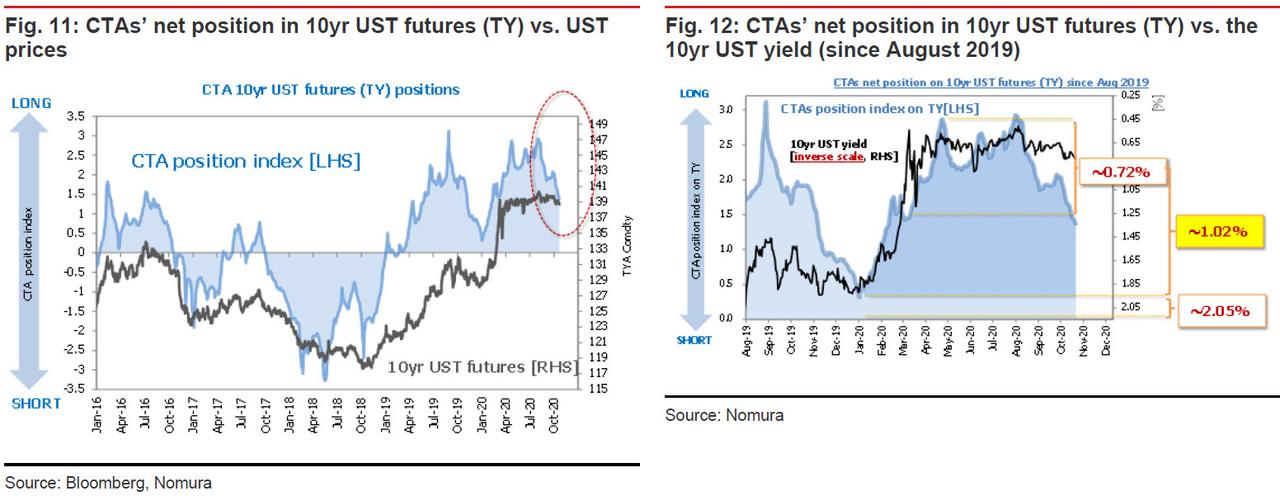
It’s not just macro funds: the cuts to long holdings by global macro HF’s has also forced CTAs into unwinding long positions in 10yr UST futures (TY). As shown below, CTAs’ aggregate net long position in TY is now about half of what it was at its August peak.
And for those wondering what the next liquidation level is, Takada writes that “the trigger line for a turnaround in the direction of CTAs’ trading is making its way up towards 1.02% from around 0.72% previously”, and in tandem with that change CTAs’ selling of TY is coming to look less like loss-cutting and more like preemptive exiting.
Here Takada points out a clear before/after split in the relationship between CTA’s net position in TY and the 10yr UST yield, with the dividing line at this spring’s pandemic-driven market shake-up.
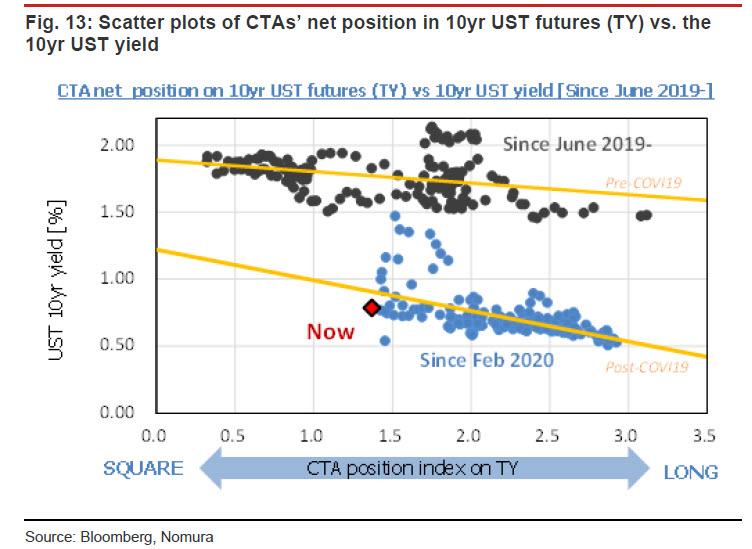
Taking this into account, he calculates that 10yr UST yield would settle at around 1.20% if CTAs were to offload the entirety of their aggregate net long position in TY. As noted above, the next break-even line for CTAs’ outstanding long positions is at around 1.02%; above that level, CTAs would move into loss-cutting mode, in which case the process of liquidating long TY positions will wrap up around the time the 10yr yield reaches 1.20%.
* * *
So while the risk is growing that CTAs – which are already selling TSYs can accelerate their liquidation – what about stocks?
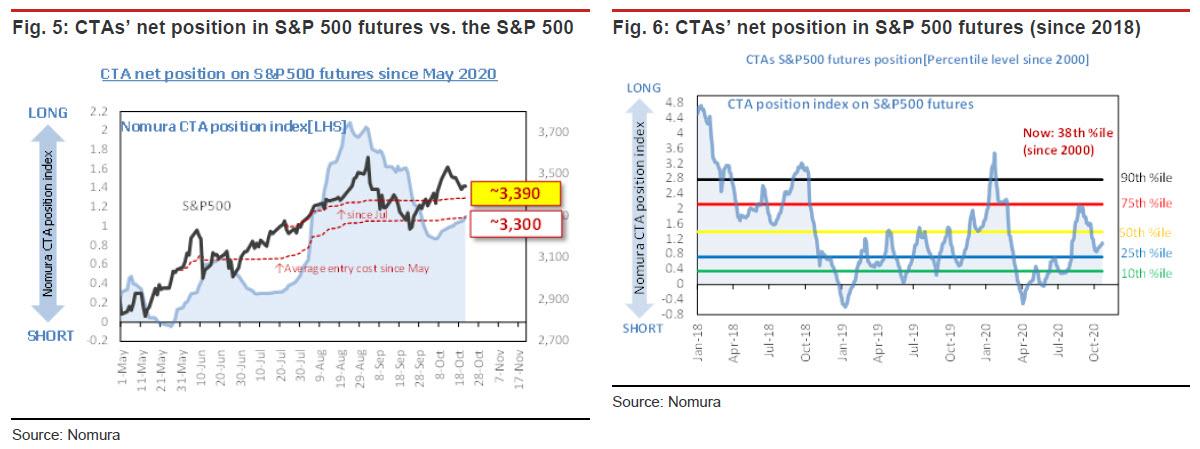
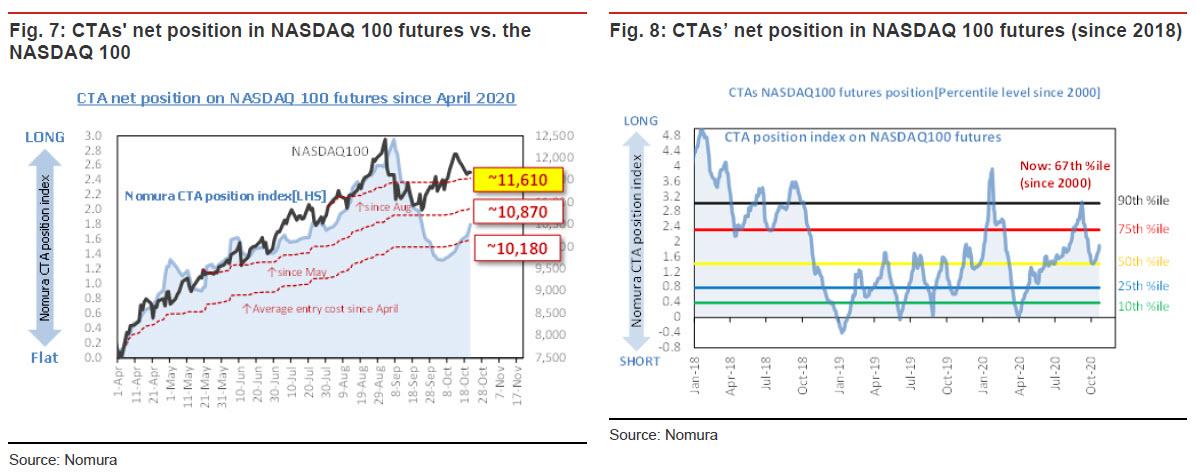
According to Nomura, trend-chasing CTAs seem to still be gradually accumulating long positions in US equity futures. Although they are likely to be drawn into more position adjustments as the US presidential election draws closer, “trend-following investors in general are still eying anything above 3,390 (for the S&P 500) and 11,610 (for the NASDAQ 100) as an invitation to continue chasing the market up”, according to Nomura. Some key observations:
- CTAs have a gradually growing aggregate net long position in S&P 500 futures. The S&P 500 has held above 3,390 despite the recent downward adjustment, during which CTAs averaged down on the assumption that the decline is a dip and not a trend. CTAs’ overall position does not look overextended, as it is at just the 38th percentile level for the period since 2000. CTAs will likely build their net long position back up to around the 50th percentile level.
- CTAs are also adding to their aggregate net long position in NASDAQ 100 futures. Systematic buying of futures is expected to continue at NASDAQ 100 readings of 11,610 or higher. That said, CTAs’ position in NASDAQ 100 futures, now at the 67th percentile level for the span since 2000, does look more top-heavy than their position in S&P 500 futures does.
![]()
Zero Hedge’s mission is to widen the scope of financial, economic and political information available to the professional investing public, to skeptically examine and, where necessary, attack the flaccid institution that financial journalism has become, to liberate oppressed knowledge, to provide analysis uninhibited by political constraint and to facilitate information’s unending quest for freedom. Visit https://www.zerohedge.com