
The Complete Election Cheat Sheet: What Happens On And After November 3
Tyler Durden
Sun, 11/01/2020 – 16:30
It’s after midnight on Nov 3, the US population has voted, and the election results are popping up across the media landscape. When will we know who is the next president? Well, due to the special circumstances surrounding this election including a record number of mail in ballots and countless court challenges involving the voting process, we may have to wait…. a while.
Below we lay out a timeline of key events and catalysts that everyone should be aware of.
After Election Day on November 3, the results of the election need to generally be finalized by December 8, which is known as the Safe Harbor Day, as this is when states select their EC Voters.
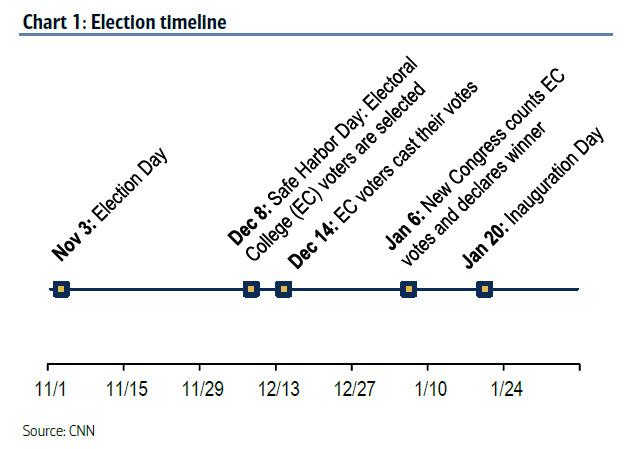
As Bank of America’s Michelle Meyer writes, in the 2000 election, this date proved to be an important factor for why the Supreme Court stopped the controversial Florida recount, which gave President Bush the win. Those selected EC voters will then officially cast their votes on December 14, to be counted by the next Congress on January 6 who will then declare the winner. Finally, January 20 is Inauguration Day which will begin the next presidential term.
The battle for the Senate
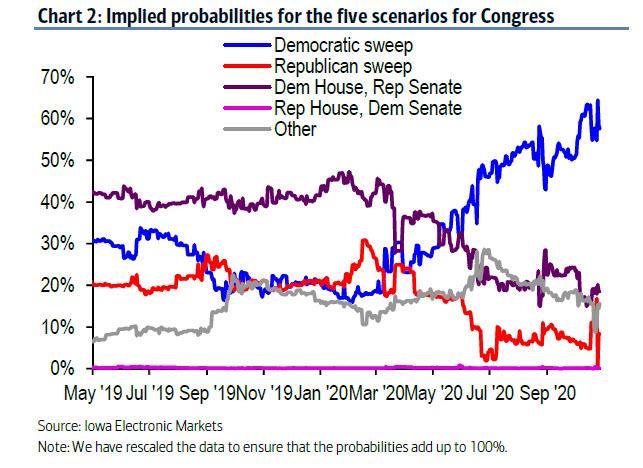
According to the Iowa Electronic Markets, the probability of the Democrats taking over the Senate and maintaining the House (Democratic Sweep) is the mostly likely outcome with a 57.5% probability, although this probability slumped on PredictIt last week sparking the furious Monday Selloff as traders braced for the risk of gridlock. But back to the IEM, the second most likely outcome with an 18.5% probability is a continued split Congress with the Republicans holding the Senate and the Democrats holding the House.
In the Senate, there are 35 seats up for grabs with 12 currently held by Democrats and 23 by Republicans. 10 of the Democrat seats are in solid Democrat states and 11 Republican seats are in likely or solid Republican states, according to the Cook Political Report. As we have discussed extensively in the past few months, there are a few seats that are at risk to flip parties. Specifically, current polling suggest Arizona (McSally) and Colorado (Gardner) are likely to turn Democrat, while Alabama (Jones) should turn Republican. That would at the very least whittle the Republican majority by 1 to 52-48. That said, 7 of the Republican seats are currently rated as toss ups with 4 in battleground states, leaving open the possibility of a Democratic majority.
That said, the overall composition of the Senate is unlikely to be determined until sometime in January due to election rules in Georgia which stipulates the race goes to a runoff if no candidates garners 50% majority in the general election and currently no candidate is projected hit the 50% threshold.
And with that in mind, here is a key primer for…
How to follow the news on Election Day. Here are a few tips from Bank of America:
Here are a few tips:
- Be wary of exit polls: The track record of exit polls is tenuous at best. In 2004, exit polls showed John Kerry winning the popular vote by 51% to 48% only to ultimately lose by the same margin. Similarly, there were major flaws in the 2016 exit polls which substantially underestimated the number of white working-class voters while overestimating the number of college-educated white voters, leading to bias results favoring Hilary Clinton. Pollsters claim they have fixed the issues ailing Election Day polls but the better mouse trap is yet unproven. Moreover, there has been unprecedented surge in early voting (both in person and mail-in) with over 70mn votes cast nationwide to-date and there is a major skew in voter day preference by party. Admittedly, pollster are aware of this issue and will enhance their methodology by polling at large and early voting centers but nevertheless this creates greater uncertainty in their estimates.
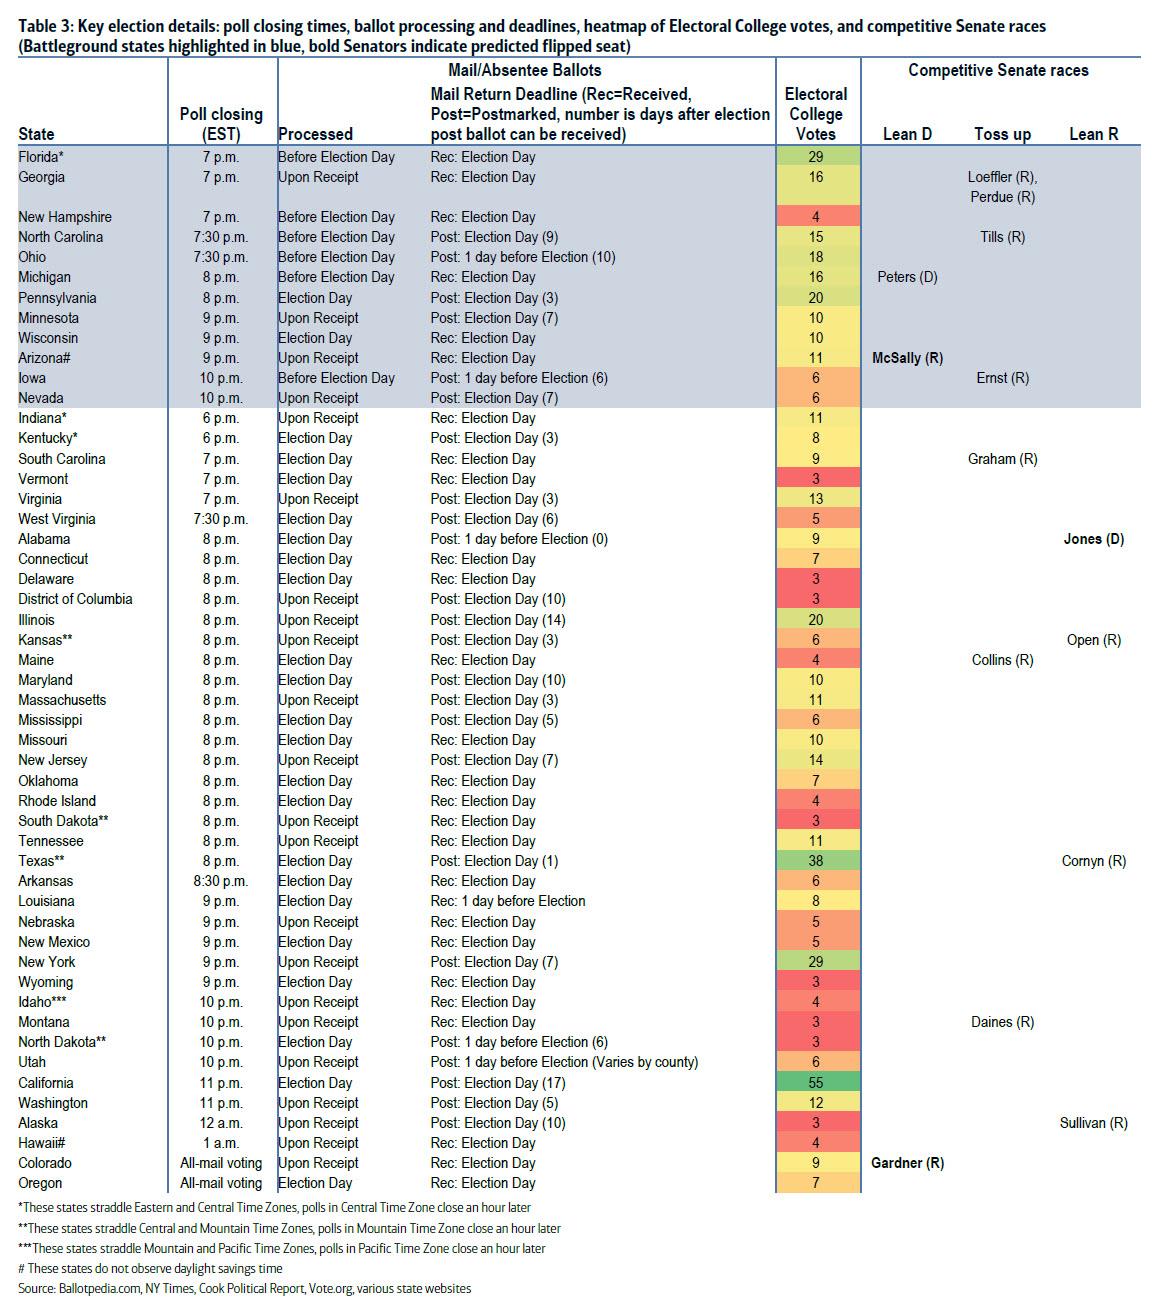
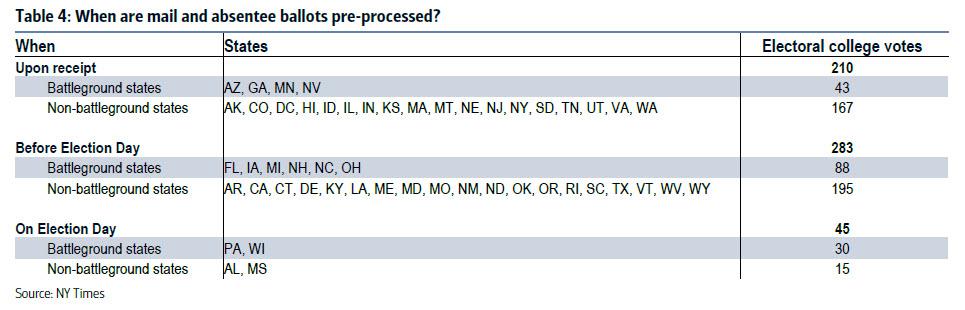
- Brace for head fakes: Results from battleground states should begin to trickle in just after polls close within each state (Table 3). First battleground states to report will be Florida, Georgia and New Hampshire where polls close at 7pm EDT (polls in Florida’s panhandle will close at 8 pm), followed by North Carolina, Ohio and Michigan, Pennsylvania, Minnesota, and Wisconsin. Type of ballots reported first will vary across states. For example, according to reporting done by the Upshot blog of the New York Times, battleground states such as Florida, North Carolina, Ohio, Arizona, and Iowa will report early in-person and processed mail-in votes first. Meanwhile, Georgia, Michigan, Pennsylvania, Minnesota, Wisconsin, and Nevada will not follow any specific order. Getting a clear sense of who is winning will be difficult given the large number of early voting by mail and absentee ballots and different rules around processing ballots, which we discuss below.
- Key demographics: In 2016, President Trump was able to tip the election by winning the older and suburban vote. A post-mortem of the 2016 election by the Pew research center showed that Trump won the age groups 50-64 and 65+ by a margin of 6 and 9 points, respectively and edged out the suburban vote by 2 points. During the 2020 election cycle, polls have shown President Trump consistently running below his 2016 election numbers in these key demographic groups. In this context, keep an eye on results coming out of suburban areas such as Maricopa County in Arizona and Peach County in Georgia and older leaning regions such as Sumter County and Pinellas County in Florida. Results in these regions could prove to be a canary in the coalmine.
For those who need a cheat sheet, here is a table summarizing the key election details including poll closing times, ballot processing and deadlines, heatmap of Electoral College votes, and competitive Senate races (Battleground states highlighted in blue, bold Senators indicate predicted flipped seat)
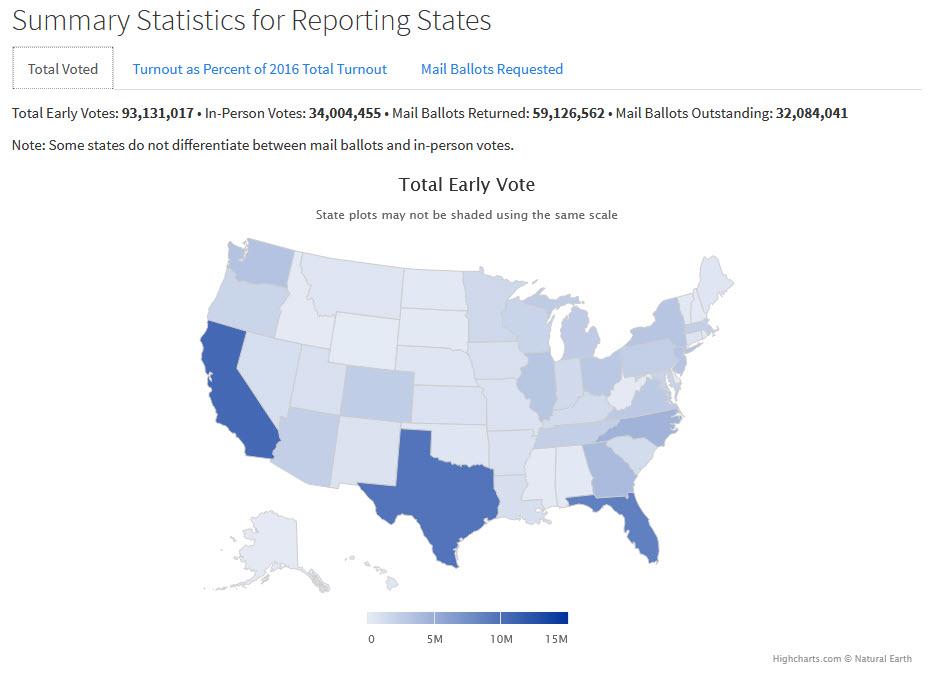
Of course, the one biggest features of this election is the record number of early voters, which at last check were over 93 million between 59 million ballots and 34 million in-person votes as of Nov 1, a whopping 67.6% of the total votes counted in the 2016 general election.
So how are the mail in ballots being counted?
According to BofA, states could have a challenging time working through such a large number of mail-in ballots. The rules also vary by state in terms of when the ballot can be sent and counted. The most common state deadline is on Election Day when the polls close (see Table 3 above).
However, some states will accept a mailed ballot if it is received after Election Day as long as it is postmarked prior. The rules differ in terms of when the ballots can be counted. Some states do not allow mail-in ballots to be opened before Election Day which could mean counting delays. This includes a few of the critical swing states – such as PA and WI. Moreover, mail-in ballots may be contested for signatures that don’t match voter registration cards.
A risk is that the lead in the race swings back and forth between Democrat and Republican candidate depending on what kinds of ballets are being counted. A recent WSJ/NBC poll found that 47% of Biden supporters plan to vote by mail whereas 86% of Trump supporters will vote in person (see here). Indeed, according to the US Elections Project website, there have been over 48 million ballots returned and of the states that identify party affiliation, 48% were Democrats, 29% were Republicans and 22% had no party affiliation. As these votes are tallied it could potentially give a lead to Biden, then in-person voting could swing the election toward Trump, then Biden could regain ground as officials work their way through remaining mail-in votes. In other words, political analysts may not feel comfortable calling the winner despite the data on hand.
Addressing this issue, Reuters has an article today discussing the “Red mirage, blue mirage”, in which it warns of early U.S. election wins:
Imagine that the polls have closed in Florida, counties are beginning to report early vote counts, and it looks like former Vice President Joe Biden is way ahead. An hour later, Pennsylvania counties begin to report and it seems to be a slam dunk for U.S. President Donald Trump.
Don’t be fooled, voting experts and academics say. Early vote counts in the most competitive, battleground states can be particularly misleading this election because of the surge in mail-in or absentee ballots, and the different ways that they are processed.
The states that count mail-in votes before Election Day are likely to give Biden an early lead, since opinion polls and early voting data suggest those ballots favor the Democrat. Conversely, the states that do not tally mail-in votes until Nov. 3 will likely swing initially for Trump.
These so-called red or blue mirages will disappear as more ballots are counted, though experts say it may take days or even weeks to process the huge number of mail-in ballots, spurred by voters seeking to avoid crowded polling stations because of the COVID-19 pandemic.
“Be patient,” said Gerry Cohen, a member of the Wake County Board of Elections in North Carolina. “You need to count all of the votes, and that’s going to take some time.”
As Reuters expands, here is what to expect in some of the most bitterly contested states :
Blue Mirage
Florida and North Carolina allow election officials to begin processing mail-in ballots weeks before Election Day, and the results of those counts are expected to be released as soon as polls close on Nov. 3. If both states follow that schedule, it is likely that Biden will appear to be ahead initially, as the latest Reuters/Ipsos opinion poll shows that people who already have voted in Florida and North Carolina support the Democratic challenger by a more than 2-to-1 margin over the president.
In both states, a majority of people who plan to vote in person on Election Day support Trump. A blue mirage is not expected to last long in either state. Experts say they expect Florida and North Carolina to finish counting most of their mail-in and in-person ballots before the end of the night.
Texas, Iowa and Ohio – which Trump won easily in 2016 but polls show could be competitive this year – also allow early processing of mail ballots, so could show a similar blue mirage, according to experts. All three states are expected to finish counting most ballots on Nov. 3.
Red Mirage
In Pennsylvania, Michigan and Wisconsin, mail-in ballots cannot be counted until Election Day. While Michigan did recently pass a law that allows many cities to start processing mail-in ballots, such as opening ballot envelopes, the day before the election, they cannot begin to count votes. Because mail-in ballots typically take longer to count than ballots cast in person, the initial results could skew Republican. Then, some experts say, expect a “blue shift” as election officials wade through the piles of mail-in ballots.
Pennsylvania and Wisconsin may be slowed by their lack of experience with high volumes of mail-in ballots. About one in 20 votes in the two states were cast by mail in the 2018 congressional election, compared to a quarter of Michigan’s votes and about a third of Florida’s.
Pennsylvania’s vote counting could go on for days. Democrats in the state recently won a victory in the U.S. Supreme Court to allow officials to accept mail-in ballots up to three days after the election as long as they are postmarked by Nov. 3.
“Something I’m prepared for on election night is for Pennsylvania to look more Republican than it may actually be, whoever ends up winning the state,” said Kyle Kondik, a political analyst at the University of Virginia’s Center for Politics.
Ballots in Wisconsin and Michigan must arrive by Election Day, although litigation is under way over whether the states should count ballots that arrive late if postmarked by Nov. 3.
Expect to wait for Arizona
On election night in 2018, Arizona Republican Martha McSally appeared to be on the road to victory in the state’s U.S. Senate race, telling her supporters she was going “to bed with a lead of over 14,000 votes.” Six days later, McSally conceded the race to Democrat Kyrsten Sinema as election officials tallied hundreds of thousands of mail-in ballots, including many from the Democratic-leaning metropolitan areas of Phoenix and Tucson that were handed in at voting centers on Election Day.
Arizona officials said they hope it will take less time to count ballots this year as Maricopa County, which includes Phoenix, has upgraded its equipment and added an extra week to handle early mail-in ballots. But if the race is close, it could still take days to fully count the votes. That would be “an indication of things going the way they’re supposed to,” said C. Murphy Hebert, a spokeswoman for the Arizona Secretary of State. “The process is complex, and we would just invite folks to be patient.”
* * *
The risk of a contested election
As is becoming clear, it is possible if not probable that we don’t have a result of the election on November 4th. The economic implications will depend on the reason and duration of the delay. We see three scenarios:
- Benign: Results are delayed due to counting backlogs given the large number of absentee and mail-in ballots but a result is expected within days.
- Painful: If the count is close, it could result in a dispute about ballot validity and lead to a recount at the state level. C
- Crisis: Either side refuses to accept the results, leading to a legislative battle and a high degree of government dysfunction
According to Bank of America, the outcome of the election will impact the economy through two critical dimensions: confidence and stimulus expectations.
An uncertainty shock
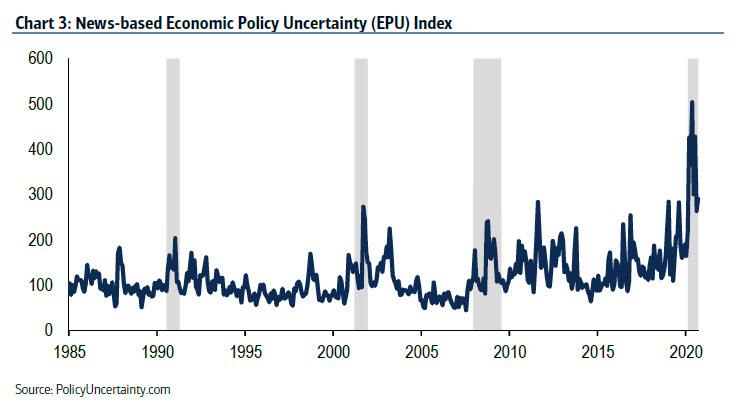
Uncertainty about result of the election could mean the following: 1) businesses delay hiring and investment; 2) households may increase precautionary savings; 3) financing costs could rise due to market stress or concern over credit losses. Since the global financial crisis, there has been increased attention on the impact of uncertainty on the economy with substantial research coming out of academia and the Federal Reserve System. One of the most commonly referenced measures of uncertainty is the Economic Policy Uncertainty (EPU) index from Baker, Bloom and Davis.
In a recent paper, Baker, Bloom, and Davis (2015) quantify the impact that uncertainty can have on the economy, using their news-based EPU measure. Using a VAR model, they found that a 90 point increase in the EPU index would lead to a peak GDP drag of 1.2pp. To put that into perspective, the news-based EPU index spiked to a high of 504 in May (on a monthly average basis) from a February level of 216 – a 288 point increase (Chart 3). Fortunately, uncertainty has come back down to 290 as of September, but this is still a net increase of 74 points.
It may not be that simple, however. Research by Jackson, Kliesen, and Owyang (2018) at the St. Louis Fed found that there are nonlinear effects of uncertainty. In order to trigger the nonlinearity of this model, uncertainty must rise above recent historical highs – as such, the potential damage from an election uncertainty shock will be lessened so long as the EPU index does not surpass the prior peak. Based on our read of the literature, if the EPU jumps half way back to the COVID peak as a result of a contested election, it could theoretically drag down GDP growth in 1H between 1-1.5pp. But this could be tempered by the fact that it is following a highly uncertain event, so there is already some degree of uncertainly already priced in. It also depends on how long the shock persists; presumably it would fade early next year. As such, we would assume something smaller than what the models imply, perhaps in the order of a 0.5-1.0pp hit to 1H GDP growth, all else equal.
The drag to the economy from heightened uncertainty would show through as a hit to confidence –confidence measures are still depressed with a modest improvement in business confidence. These confidence measures are vulnerable to the potential double whammy of a contested election + increase in the spread of the virus.
The story for stimulus
The first order impact of the election will be on the trajectory for additional stimulus. Here are our expectations:
- Biden win + Democratic Congress (‘Blue wave’): $2.0 – 2.5tr in stimulus, including additional funds for the COVID health response. Passed right after inauguration.
- Biden win + divided Congress: $500bn – 1tr in stimulus. Passed after inauguration but with some delay. There is also some chance of continued gridlock in this scenario.
- Trump win + divided Congress (‘Status quo’): $1.5 – 2.0tr in stimulus. Passed in the lame duck session because neither side gains an advantage by waiting for a new government to form.
Needless to say, a clear victory could accelerate stimulus negotiations. This is particularly the case if it returns the status quo so neither side has a reason to delay. The two sides are not that far apart — both agree on additional unemployment insurance (around 100% replacement income which is about $300-400 additional/week) and aid for small businesses. They disagree over state & local aid and liability protections for businesses but these appear surmountable hurdles. It is even possible that stimulus is passed in the lame duck session with a status quo result.
The worst case scenario, and one which could lead to a 20% drop in markets according to BofA, a scenario of a Biden victory with a Republican Senate could make it harder to get any package through, creating a risk of sustained gridlock. By contrast, a “Blue Wave” would make a stimulus package very likely by February, one that is likely in excess of $2tr. Under any election result, there will be much more clarity on the path for fiscal stimulus with a fading of the uncertainty shock.
In the event of a contested election that looks like either scenario 2 or 3, the political environment creates a challenge for additional stimulus. Markets will likely become discouraged about the prospects for compromise. However, there is a threshold. If markets sell off violently and the economic data deteriorate, we could see Washington facilitate the passage of stimulus even in a highly contentious environment.
To summarize, BofA believes that an election result of status quo could lead to an earlier passage of stimulus (in lame duck), a “Blue Wave” makes a stimulus package very likely but only after inauguration and a highly contested election would likely create an impediment to stimulus but if the markets and economy deteriorate, an emergency stimulus could be triggered. A clear victory would be a net positive for the economy as it reduces some of the negative risk from higher uncertainty. A Blue Wave likely means greater stimulus which thereby provides the greatest near-term boost to the economy.
The Fed wild card
If there is not a result and financial conditions tighten due to a contested election, BofA believes the Fed’s credit facilities will once again be needed. The Fed could consider easing terms to facilitate the flow of credit. The Fed could also ramp up the QE program, buying Treasuries and MBS at a faster rate, as well as corporate credit as needed, particularly if it sees concerns over market liquidity. Ultimately the focus could be on credit (MBS and corporate credit) versus USTs in a risk-off scenario. Or as BofA recaps, “the Fed has tools and will use them.”
Legislation
The timeline for legislation action will depend on who controls the Senate. If there is a Blue wave, we can assume there will be parallels to the first 200 days of Presidents Obama and Trump in which both had a united Congress. When Obama took office in 2009 he faced an economic collapse from the Global Financial Crisis requiring immediate passage of stimulus. Indeed, the American Recovery and Reinvestment Act was passed on January 28, 2009, just 9 days after the inauguration. He then tackled his number one legislative priority – health care reform – but the Affordable Care Act wasn’t signed into law until March 2010. Similarly, Trump still faced obstacles in passing the Tax Cuts and Job Act, which was signed into law on December 22, 2017. Thus, even with a sweep, we therefore think it is reasonable to assume that the legislative agenda won’t be realized until early 2022
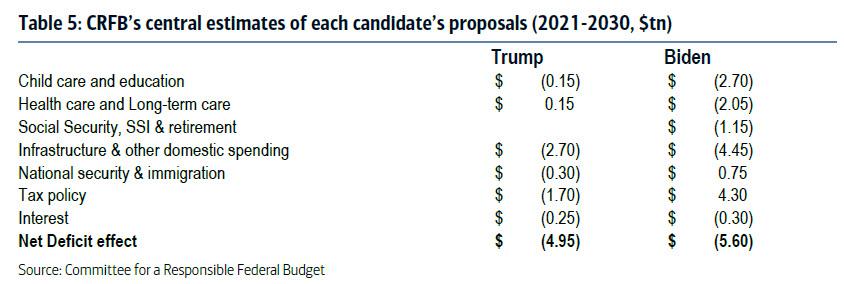
The Biden-Harris team has proposed a detailed agenda including increasing spending on child care and education, health care, retirement, disability benefits, R&D, infrastructure and climate change among others. This would be partly financed by increasing taxes on high-income households and corporations. According to the Committee for a Responsible Federal Budget (CRFB), Biden’s spending programs would total $10.65tr over a 10 year period but would be offset by tax revenues of $4.3tr and $750bn in savings from immigration reform (Table 5). The CRFB also come up with a potential path under a Trump second term, although they admit that there is more guesswork. They find that there would be a $5.1tr increase in spending with the bulk focused on infrastructure of $2.7tr. Tax policy would also be deficit negative, costing $1.7tr.
Depending on the political environment, the economy might receive another boost in early 2021 from legislative changes. However, despite potentially a large price tag, it is unlikely to provide the same jolt to the economy as the COVID-related stimulus. The policies focus on the medium term, particularly infrastructure spending and education reform. The most fiscal restraint will likely be under a scenario of Biden and a divided Congress while the easiest path to fiscal expansion should be under a Blue wave.
![]()
Zero Hedge’s mission is to widen the scope of financial, economic and political information available to the professional investing public, to skeptically examine and, where necessary, attack the flaccid institution that financial journalism has become, to liberate oppressed knowledge, to provide analysis uninhibited by political constraint and to facilitate information’s unending quest for freedom. Visit https://www.zerohedge.com