19th Century Prices, 21st Century Lessons
Tyler Durden
Sat, 11/14/2020 – 12:15
Submitted by Nicholas Colas of DataTrek Research
We have some observations based on the 1919 book “A Century of Prices”. The 1800s saw structural deflation due to technological advances in manufacturing and farming. This pulled interest rates lower (as has also occurred in the last 20 years), but numerous financial crises/recessions from 1865 – 1910 put a lid on stock prices. The book’s authors rightly assumed the then-new Fed would reduce the magnitude and frequency of future funding crises, but still thought human judgment would drive boom-bust stock markets.
We recently got our hands on an original copy of a 1919 book titled “A Century of Prices” by Theodore Burton and George Selden. Regular readers know we are fans of pre-World War II financial literature, both for its historical lessons and its ability to remind us that environment drives the human narratives which shape capital market prices.
Before we dive into the content, it is worth remembering that the publication date was just 54 years after the end of the US Civil War, analogous to 1966 today and both 5-decade periods (then and now) were times of social and technological change.
-
Burton was born in 1861 and penned his portion of the book while on a Wall Street hiatus from the US Congress.
-
Selden’s biographical details are lost to history, but he was a prolific financial journalist and managing editor of The Magazine of Wall Street in the 1910s.
-
Both authors, therefore, had already lived through numerous wars and financial crises and also seen remarkable technological achievements like radio and powered human flight from their earliest days through to commercialization.
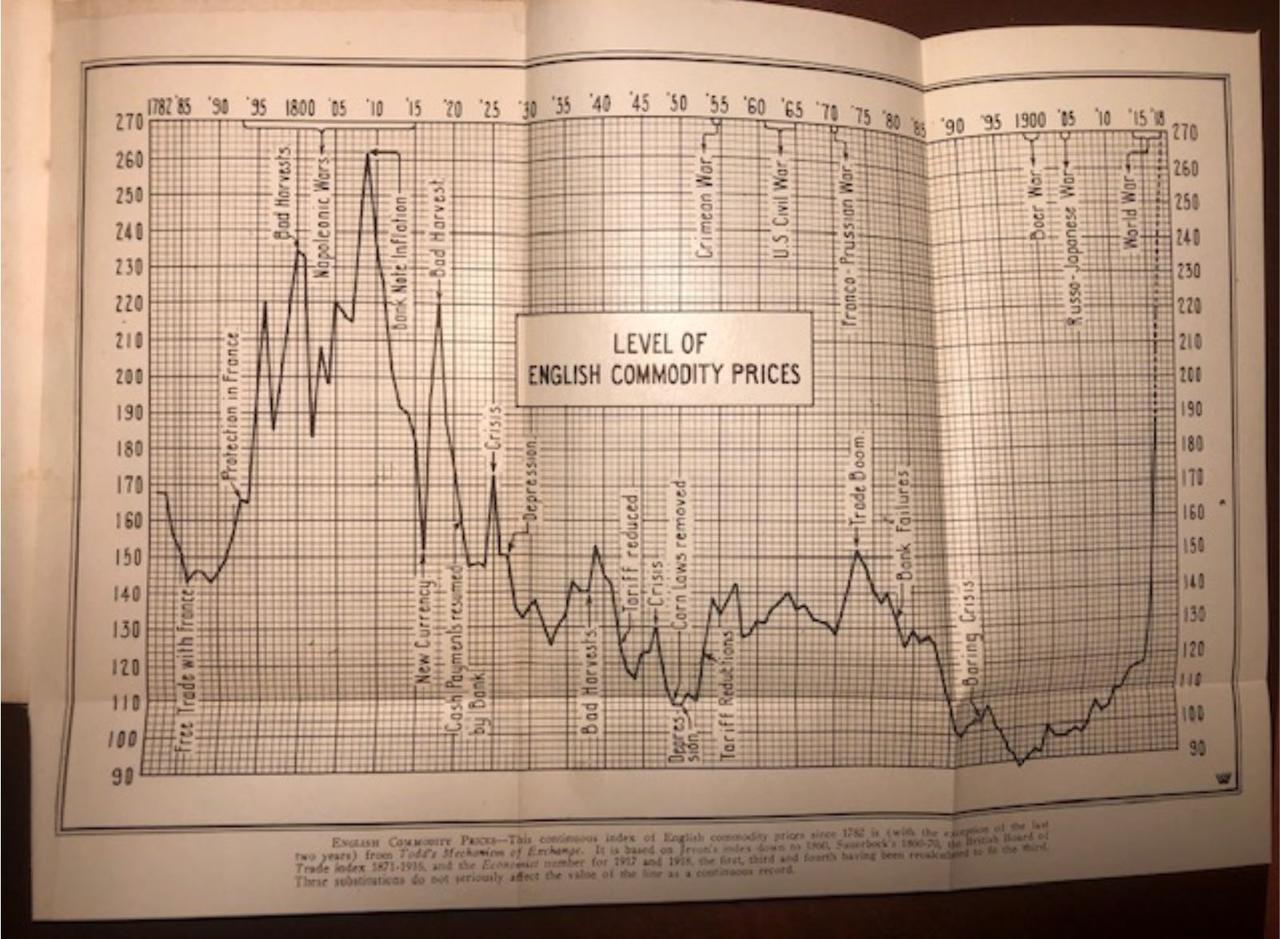
The book begins with a look at English commodity prices and bond prices/interest rates from the 1780s to 1918. The authors start here both because reliable long-run data was available and, more importantly, Great Britain was the world’s economic superpower in the 19th century.
Here is the commodities price chart:
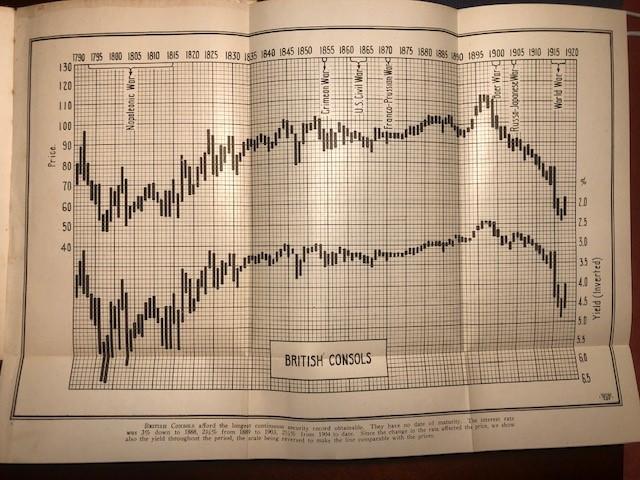
And here is price (upper bar chart, left Y axis) and yield (lower bar chart, right Y axis) for British consolidated debt, or “consols” – perpetual government debt:
Three points of interest here:
#1: The 1800s was a century of commodity deflation caused by technological advancement.
As Burton and Selden explain, “The principal cause of this decline was the cheapening of production through improvements in machinery and in transportation. The machine-made shoe is cheaper than the hand-made shoe because less human labor is necessary to make it. Wheat raised by the aid of the tractor, the harvester and the threshing machine, and moved to market over the railroad, is cheaper than wheat sown and reaped by hand or by hand tools and hauled by horses over rough and muddy roads. And this transformation has extended throughout all industry.
#2: Money supply can, however, temporarily reverse secular trends to lower prices. As the first chart shows, prices rose from 1850 to 1873 and 1896 to 1914. According to Burton and Selden, a sudden threefold increase in the global supply of gold from finds in California and Australia in the early 1850s and another fourfold increase from 1893 – 1912 from new discoveries in Alaska were to blame for higher prices. The world was, after all, entirely on a gold monetary standard at the time.
#3: The chart of British consol prices/yields is remarkable because these are so stable from 1830 – 1910. Yes, the American Revolution and Napoleonic Wars jacked yields to 5 – 6 percent, but past 1835 the British government could finance itself at a steady 3 percent (and even just 2.5 percent in the 1890s) for decades at a time. That, we can assume, was due to Britain’s preeminent status as both world power and the center of the global financial system.
Lessons for today: first, technology has a long history of driving structural deflation and second, global reserve currency status lasts for a long time.
Now, let’s move on to US corporate debt and stock prices.
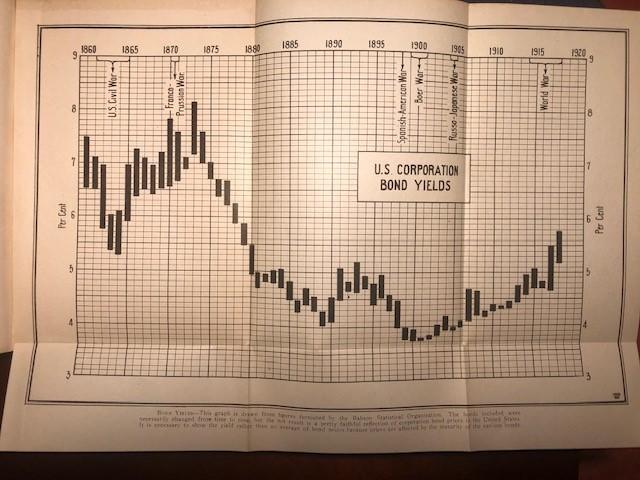
Here are US corporate bond yields from 1860 – 1917:
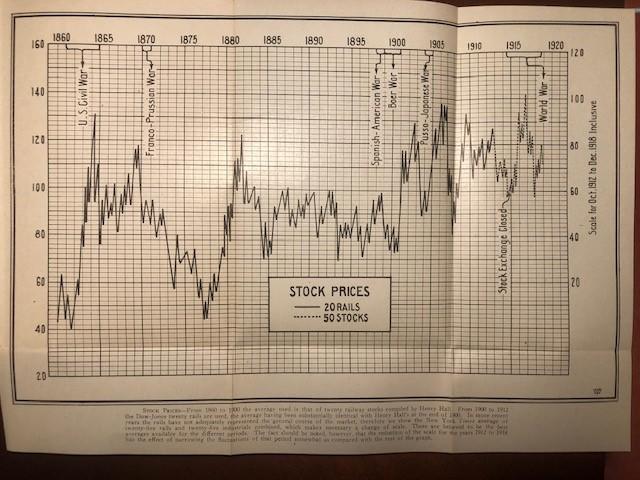
And here are US equity prices in the form of a 20-stock average of rail equities from 1860 – 1913 (left axis) and a larger 50-stock average (right axis, mostly scaled to match the left):
Three points here:
#1: While we have not included the book’s chart of US commodity prices from 1845 – 1918 to save space, these line up fairly precisely with corporate bond yields. The Civil War was quite inflationary (5.5 percent CAGR, 1860 – 1865), with US price levels peaking in 1865 and remaining elevated through 1870. For the next 27 years to 1897, inflation declined by a CAGR of -1.8 percent annually. Inflation did eventually pick up in the 1890s and early 1990s, and corporate bond yields rose with them.
#2: What is interesting is the authors do not ascribe the decline in yields to lower inflation (what modern eyes like ours see), but rather to something akin to rising credit quality among US corporations:
“The great fall in bond yields from the period of the ‘70s to 1900 was partly due to the better standing and stronger protection of our corporate bonds as a whole in the later years; but it was also largely due to the great increase in production of goods as a result of improvements in machinery and transportation. When labor produces more goods it is naturally easier to accumulate capital.”
#3: As for the stock price chart, we were surprised to see that US equities were somewhat of a volatile hot mess for the entire 1860 – 1919 period. They were more than cut in half from 1864 to 1878, then more than doubled through 1883, but then gave up most of those gains and treaded water until 1900.
Selden implicitly attributed this choppy zero-return environment to the frequent panics that occurred through the period. He counts 9 distinct bouts of suddenly tight short-term funding markets, all but one of which caused stocks to swoon along with 11 economic cycles running alongside these financial events. It is a good reminder that it’s not just earnings and rates that drive valuations, but investors’ perceptions of financial stability.
To the modern reader, Selden’s observation in the penultimate paragraph of the book seems prophetic (remember that the Fed had only been established 6 years before):
“The Federal Reserve System, with its easy rediscounting, will prevent extremely high money rates and may even have the effect of reducing the general average of rates somewhat.”
I trust this review’s utility is largely self-explanatory, at least as far as what lessons history can teach, so I want to close out on a bit of Selden’s commentary that – and remember this was written in 1919, after 50 years of extreme equity volatility – seems especially appropriate today:
“At low prices, stocks are mostly in the hands of courageous, outright investors, who cannot easily be frightened into selling. As prices rise, more and more stocks pass into the hands of buyers for profit only. The higher quotations go, the more the public comes into the market…
Buyers at higher prices are necessarily of a weaker class – weaker in judgement and therefore weaker in resources – than buyers at lower prices…
Eventually these weak speculative holders have bought all they want, or some of them become discouraged, or some unfavorable event dampens their ardor. They then begin to sell out on each other – since prices are too high to attract genuine investors for income.
For such a situation there is no cure except a decline to a level which will attract the stronger class of buyer…”
In summary: in many ways the US financial system is far more robust than in 1919, but we should remember that human nature is pretty much the same as 100 years ago.
![]()
Zero Hedge’s mission is to widen the scope of financial, economic and political information available to the professional investing public, to skeptically examine and, where necessary, attack the flaccid institution that financial journalism has become, to liberate oppressed knowledge, to provide analysis uninhibited by political constraint and to facilitate information’s unending quest for freedom. Visit https://www.zerohedge.com