
Irrational Exuberance – The Bulls Remain In Control
Tyler Durden
Sun, 12/13/2020 – 11:25
Authored by Lance Roberts via RealInvestmentAdvice.com,
Bullish Bias Continues
Over the past couple of weeks, we have talked about a short-term correction potential due to selling pressure from annual mutual fund distributions. We saw that taking place this past week with the market struggling to maintain its breakout levels.
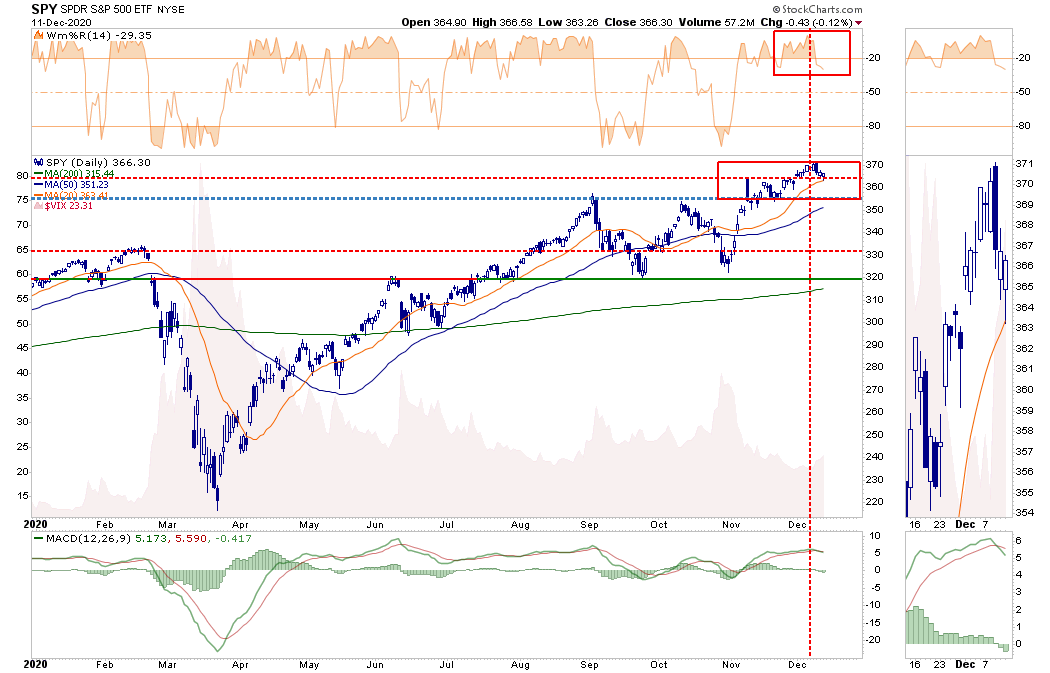
The good news is the “bullish bias,” or rather momentum, of the market was strong enough to offset the selling pressure. Notably, the market held support at the recent breakout levels.
The not-so-good news is the markets remain significantly extended and deviated from means, and the bullish sentiment is very lopsided. Furthermore, the MACD signal has triggered a short-term “sell signal.” Such setups have often been coincident with more important short-term corrections.
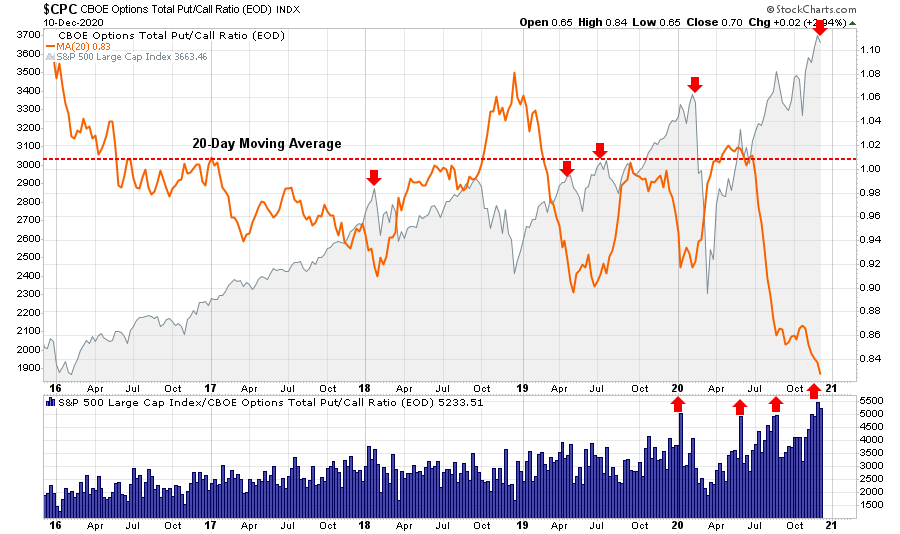
Nonetheless, we could get a bit more weakness into next week as year-end “options expiration” occurs on Friday. With the heavily skewed “put-call” ratio currently, we could see volatility pick up as options traders roll positions over into 2021, or selling occurs to take “tax losses” for 2020.
Such could provide a reasonable trading entry for a post-Christmas “Santa Claus” rally as portfolio managers add holdings to “window-dress” portfolios for year-end reporting.
However, once we get into 2021, much will depend on getting a stimulus package passed and the vaccine delivered. If either of those fails to occur promptly, or the economy slips back into recession, the downside risk increases.
That is a story for next year. For now, it is all about the “Santa Claus” rally and our year-end price target for the market.
Approaching 3750 Target
In August, I laid out a target for 3750 for the S&P 500 by year-end.
“Technical analysis works well when there are defined “knowns” such as a previous top (resistance) or bottom (support) from which to build analysis. However, when markets break out to new highs, it becomes much more of a ‘wild @$$ guess’ or ‘WAG.’
That target was derived when I previously set out several “risk/reward ranges.”
“With the markets closing just at all-time highs, we can only guess where the next market peak will be. Therefore, to gauge risk and reward ranges, we have set targets at 3500, 3750, and 4000.”
I have updated the chart below. The “black arrow” was where I initially did the analysis.
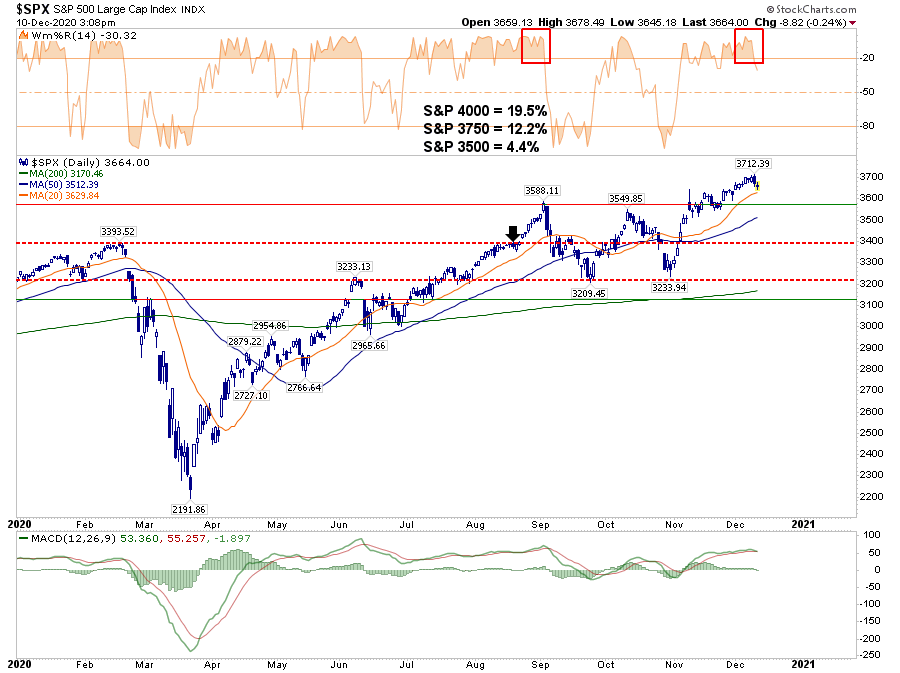
Since that point, the market spent a couple of months making very little headway. However, as noted in “Market Surges As Election Turns Into Optimal Outcome:”
“It was quite the reversal. The rally pushed the market back above the 50-dma and the downtrend of lower highs. Such sets the market up for a retest of all-time highs next week.”
Since then, not only did the markets set a new high, but they have kept pushing higher despite a rising number of warning signs.
The Disposition Of Risk & Control
The one thing that tends to get investors in trouble, more often than note, is when the market remain irrational longer than logic would predict. When such occurs, individuals are prone to dispose of their regular “risk controls” and chase the markets higher.
Of course, it’s not just the analysts that are overly optimistic. In the short-term, investors cling to the idea that “fundamentals don’t matter.” Such is not entirely incorrect as “market momentum” is a hard thing to kill. When the “Fear Of Missing Out” overrides logic, the markets can make irrational moves. As noted in “Is The Narrative Priced In?”
“You have to wonder precisely how much ‘gas is left in the tank’ when even ‘perma-bears’ are now bullish. Therefore, the question we should ask is ‘if everyone is in, who is left to buy?’”
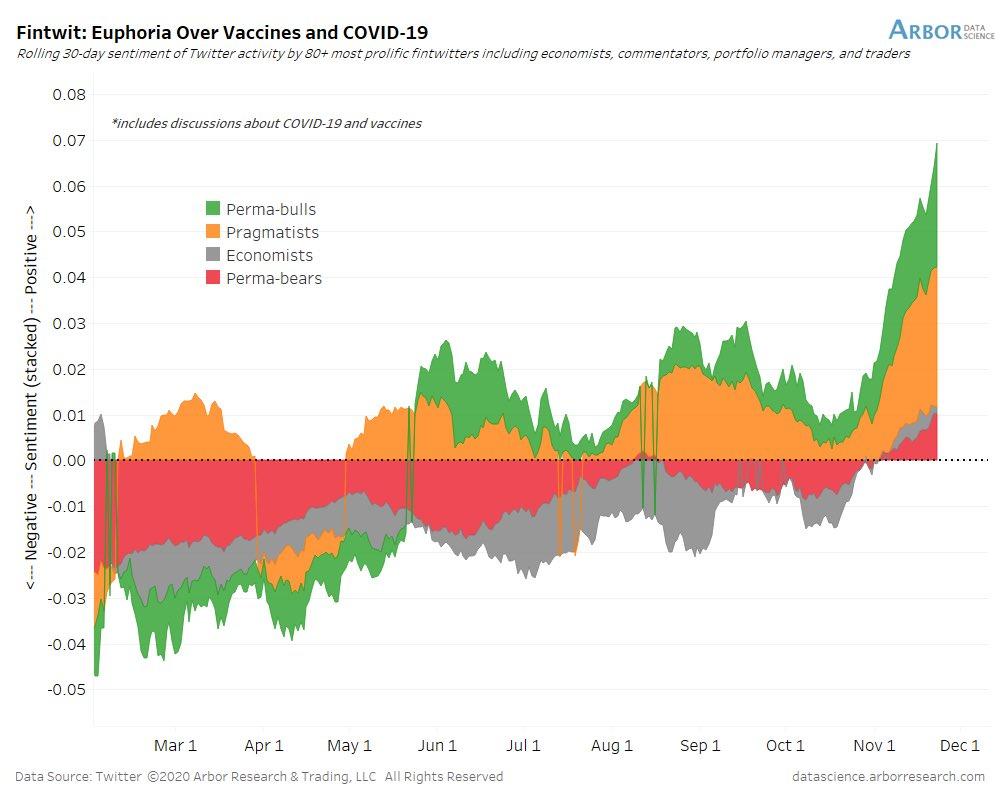
Excessive bullish sentiment does NOT mean a correction MUST occur. Much like “gasoline” stored in a tank, it requires a “catalyst” to ignite a change in an investor’s outlook.
No One Saw It Coming
Many issues could provide such a “spark.”
-
The vaccine is not readily available until after mid-year.
-
A problem emerges from the vaccine as, during distribution, unexpected side effects occur.
-
Despite the vaccine, the economic data weakens more than expected.
-
Earnings growth falls short of expectations.
-
Corporations continue to hoard cash and reduce share buybacks, which leads to a rising number of earnings “misses.”
-
The Republicans maintain control of the Senate, and expected stimulus bills are smaller.
-
Rent and Mortgage moratoriums do not get reinstated, and defaults and evictions surge.
-
Interest rates rise, and corporate defaults and bankruptcies surge as debt fails to get refinanced.
-
After the next round of stimulus runs out, everyone realizes the real problems with the economy.
-
The dollar surges, and foreign exchange flows into the U.S.
-
The “reflation trade” turns out to be “deflation trade.”
Which one will it likely be?
My best guess is Number 12.
You are correct. There is no “Number 12.” When everyone is long equities and leveraged, it is always an unexpected, exogenous event, which begins the rush for the exit.
If you don’t like my list, here is Jim Reid’s list from Bank of America.
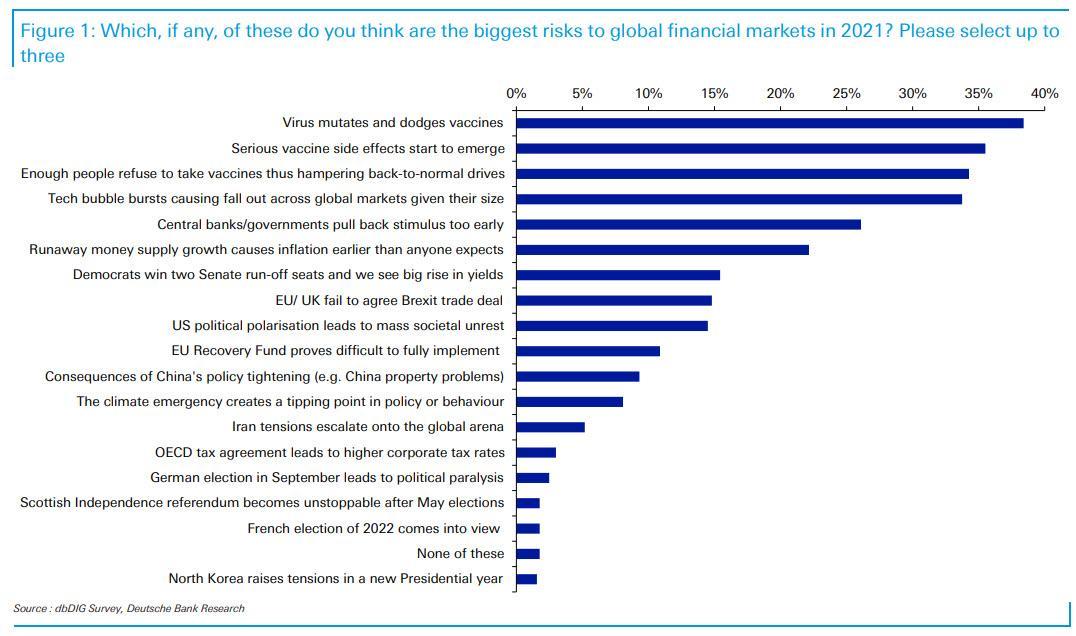
What exactly will that catalyst be? No one knows, just as no one expected the “pandemic” in March.
Whatever the catalyst eventually is, the media’s excuse will be:
“No one could have seen it coming.”
Mid-Cap Moonshot
In the short-term, the market seems headed higher. However, it is worth remembering the reason it is called a “market peak.” Such is the point where prices stopped going up. Previous peaks are the graveyard of investors who believed prices could not go down.
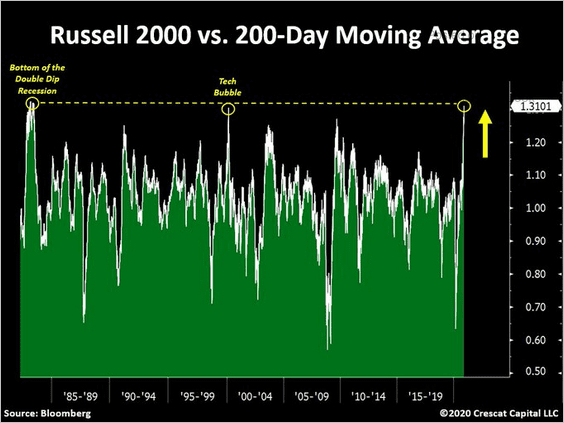
Currently, there are some signs of more extreme conditions that have previously suggested investor caution. For example, the Russell 2000 is now as deviated from its 200-dma as it was in 1999.
Over the past 15-years, there is no point where IWM was more than 3-standard deviations above its 200-week (4-year) moving average, overbought, and trading above 3.5 on its MACD.
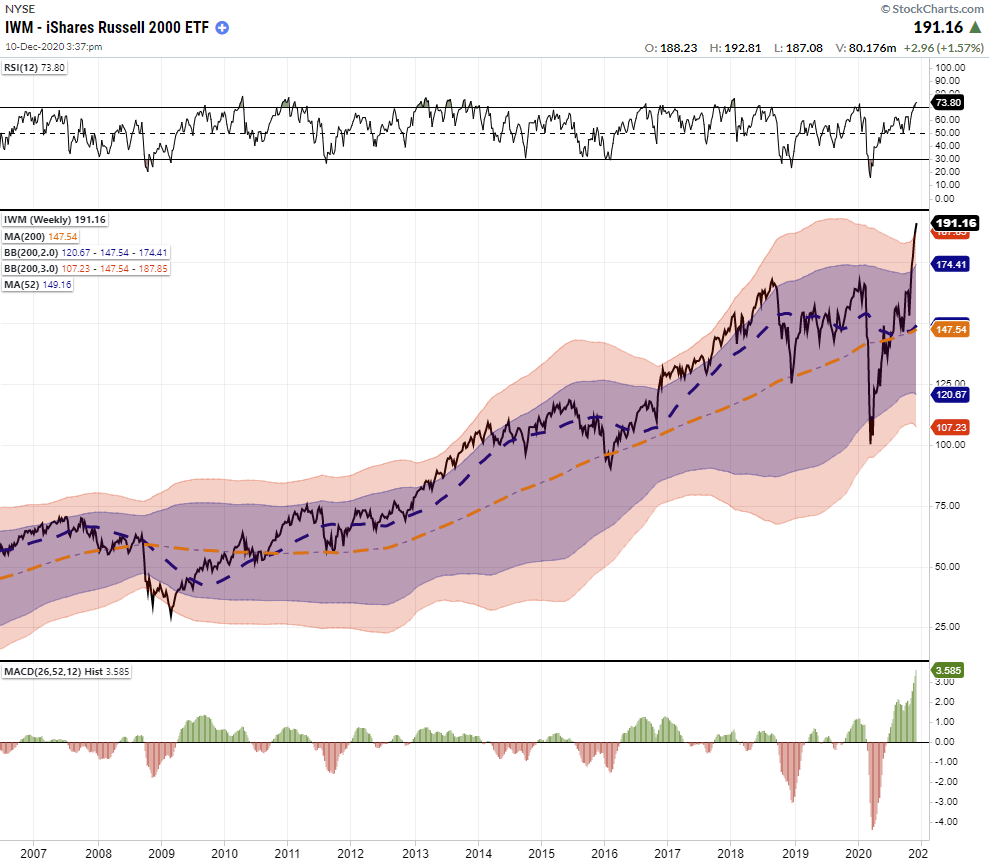
While these extreme measures can indeed be maintained “longer than expected,” the very laws of physics require a reversion in price.
S&P Extremes
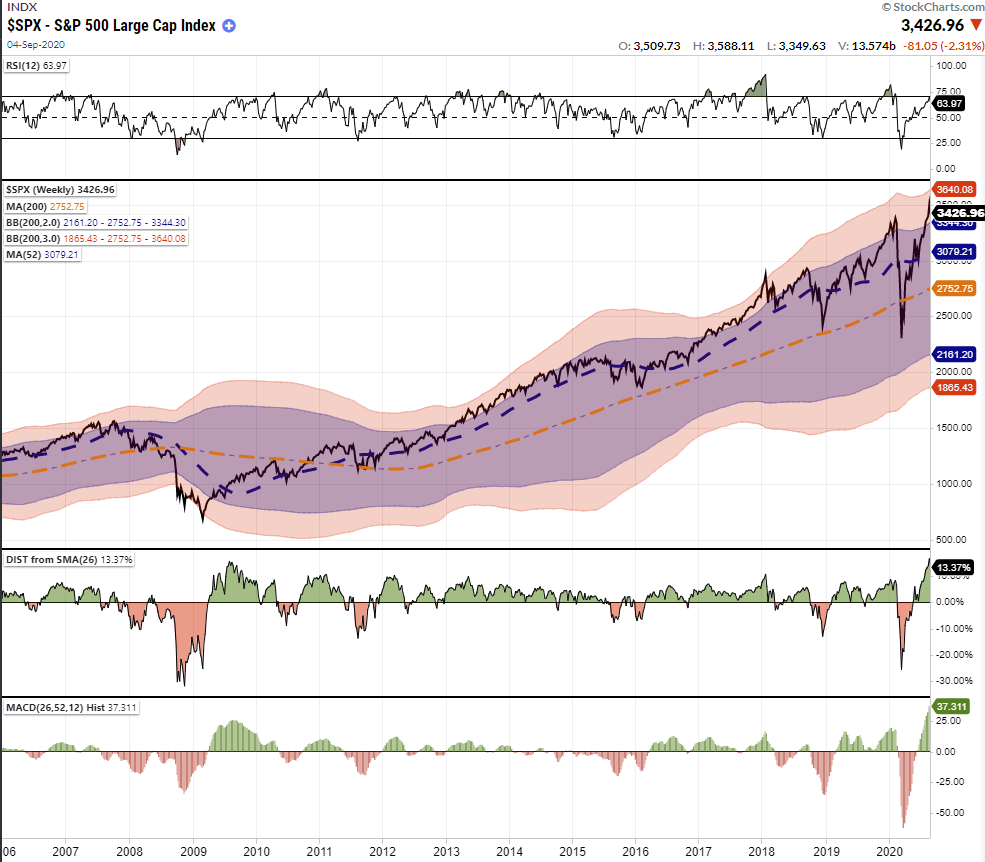
We also see the same issues presenting themselves in the S&P 500 index as well.
-
Despite the rally since 2018, the market has continued to exhibit a negative divergence in relative strength.
-
The market is once again pushing well into 3-standard deviations above the 4-year (200-week) moving average.
-
The market is now 13.37% above the 4-year moving average, which matches previous highs.
Currently, the evidence is mounting that markets are reaching the limits of the current move. By themselves, these signs reflect the prevailing extremely bullish attitude of market participants.
However, importantly, these more extreme extensions provide the “fuel” for a sell-off given an unexpected catalyst. The ensuing “reversion” tends to catch overly confident “bulls” off guard.
Calculating The Madness
Let me repeat something which seems apropos currently:
Sir Isaac Newton once said:
“I can calculate the motions of the heavenly bodies, but not the madness of the people..”
As we head into year-end, we will be navigating the risk of overly extended and bullish markets against the seasonally strong end of year period.
We believe that over the long-term, capital preservation and risk management leads to better outcomes. However, sometimes, in the short-run, managing risk can undoubtedly be a frustrating endeavor as the “Fear Of Missing Out” overrides common sense and logic.
If you disagree, that is okay.
When the opportunity presents itself, and the “madness has subsided,” these are the questions we will ask ourselves before we add exposure to portfolios:
-
What is the expected return from current valuation levels? (___%)
-
If I am wrong, given my current risk exposure, what is my potential downside? (___%)
-
If #2 is greater than #1, then what actions should I be taking now? (#2 – #1 = ___%)
How you answer those questions is entirely up to you.
What you do with the answers is also up to you.
We are all trying to answer the question, “how much of the ‘narrative’ already got priced into the market?”
By looking at the data, it would be easy to assume the answer is “much.”
Portfolio Positioning Update
While we remain primarily long-biased in our portfolios, we hold a higher than average level of cash. Such is for several reasons.
-
Cash provides a risk-free hedge against market volatility.
-
It provides us an opportunity to add exposure for a year-end “Santa Rally” selectively.
-
It also gives us the ability to reposition into either further defensive or offensive, positioning depending on outcomes.
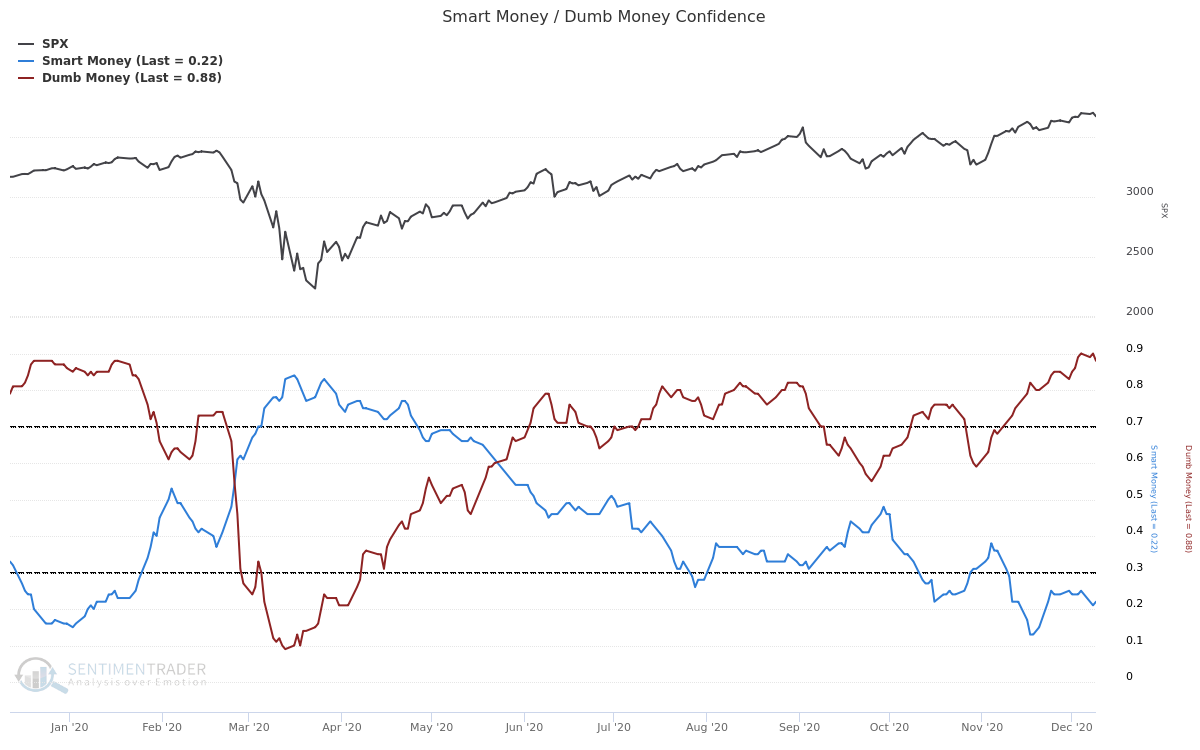
In short, having cash gives us the flexibility to take advantage of “dumb money,” which is historically wrong near market peaks. The trick is having the patience to wait it out.
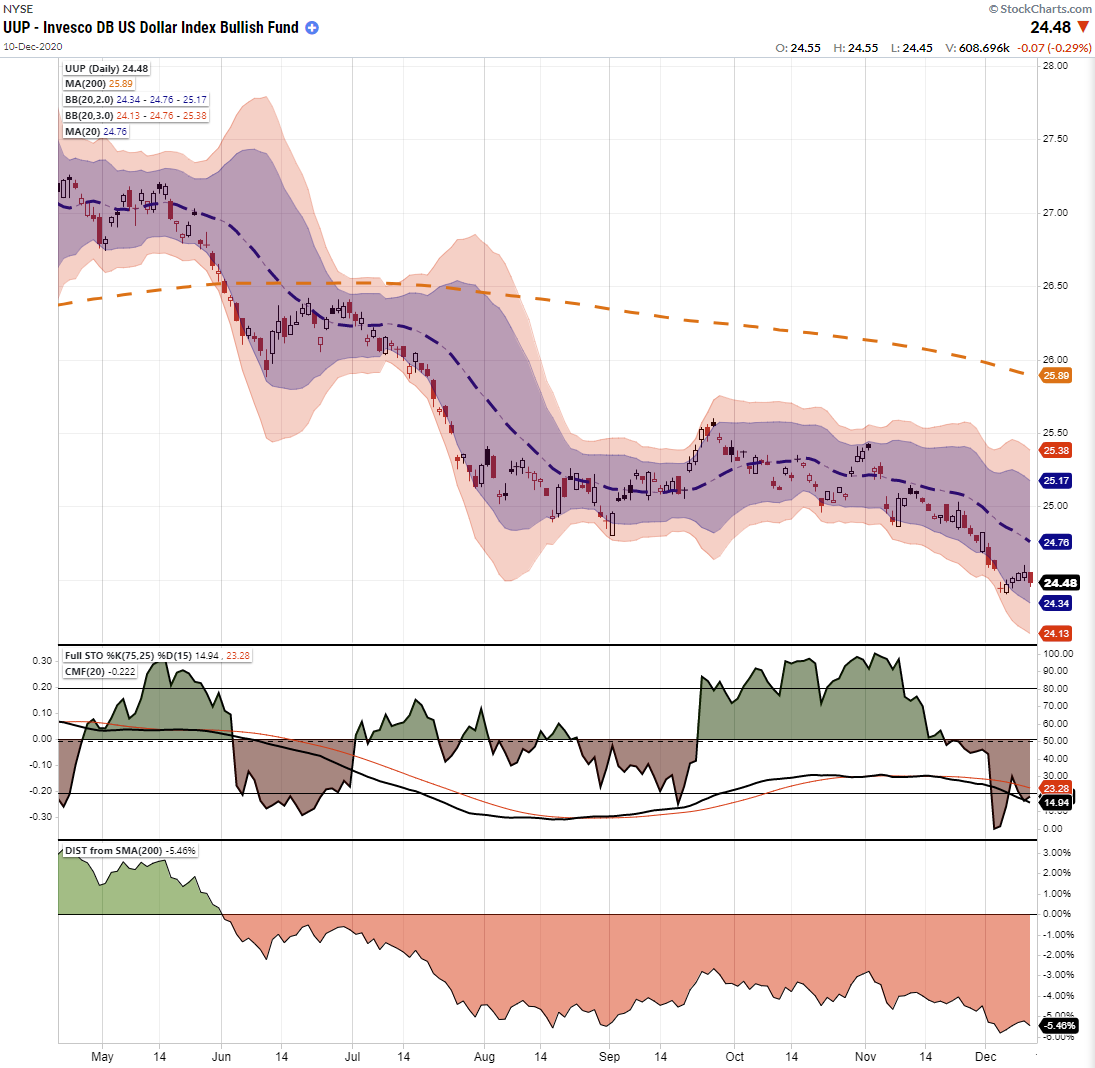
Lastly, we are also watching the U.S. Dollar very closely. It is now extremely oversold with a large net-short position. Such is a prime setup for a rather sharp reversal, which would lead to lower prices in commodities, stocks, emerging markets, international markets, and bitcoin.
The markets are indeed currently exceedingly exuberant on many fronts. With margin debt back near peaks, stock prices at all-time highs, and “junk bond yields” near record lows, the bullish media continues to suggest there is no reason for concern.
Of course, such should not be a surprise. At market peaks – “everyone’s in the pool.”
“The investor’s chief problem – and even his worst enemy – is likely to be himself.” – Benjamin Graham
![]()
Zero Hedge’s mission is to widen the scope of financial, economic and political information available to the professional investing public, to skeptically examine and, where necessary, attack the flaccid institution that financial journalism has become, to liberate oppressed knowledge, to provide analysis uninhibited by political constraint and to facilitate information’s unending quest for freedom. Visit https://www.zerohedge.com