
What 2020’s Equity Volatility Says For 2021
Submitted by DataTrek Research
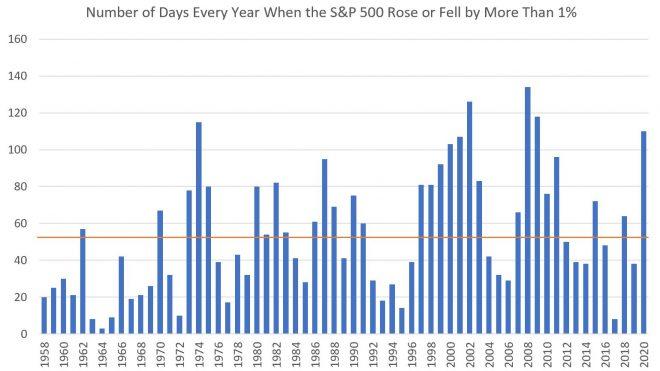
US equities are off to a rocky start to 2021 after an especially volatile 2020, which is exactly why we count the number of trading sessions when the S&P 500 moves more than 1 percent up or down (like Monday). This is our fundamental benchmark of how much investors “feel” volatility, as any one-day move greater than 1 pct to the upside or downside is +1 standard deviation from the S&P’s mean daily return back to 1958.
For example, while there is typically one +/-1 pct day/week in normal times, the S&P rose or fell by 1 pct or more on 110 trading days in 2020. That accounted for almost half (43 percent) of trading days last year and marked the fifth most volatile year in the past 6 decades by this measure. Here is the final tally for 2020’s count on a quarterly and annual basis:
-
Q1 2020: 30 one percent days versus the Q1 average of 13 since 1958 (first full year of data).
-
Q2 2020: 38 one percent days compared to the Q2 average of 13.
-
Q3 2020: 21 one percent days versus the Q3 average of 13.
-
Q4 2020: 21 one percent days versus the Q4 average of 14.
-
2020 overall: 110 one percent days, more than double the whole-year average of 54 over the last 6 decades.
The upshot: the S&P has registered 100 or more “plus-one percent days” seven times including the just-completed year over the past +6 decades, or only 11 percent of the time. Therefore, let’s look at what happens in the first quarter relative to returns and volatility after these rare years of elevated equity market churn.
Here are the results, clustered into 3 periods:
Period #1:
1974 (115 one percent days total, -25.9 pct total return):
- Q1 1975: +21.6 pct on a price basis, 25 one percent days
Comment: This particularly volatile year came after 1973’s poor performance for the S&P when it fell by 14.3 pct amid the Saudi Oil Embargo and resultant energy crisis.
Period #2:
2000 (103 one percent days, -9.0 pct total return):
- Q1 2001: -12.1 pct, 29 one percent days
2001 (107 one percent days, -11.9 pct total return):
- Q1 2002: -0.1 pct, 19 one percent days
2002 (126 one percent days, -22.0 pct total return):
- Q1 2003: -3.6 pct, 31 one percent days
Comment: a slew of shocks that were both economic (Dot Com Bubble Burst) and geopolitical (domestic terror attack and international oil shock) created sharply negative returns and magnified volatility for three consecutive years in the early 2000s.
Period #3:
2008 (134 one percent days, -36.6 pct total return):
- Q1 2009: -11.7 pct, 41 one percent days
2009 (118 one percent days, +25.9 pct total return):
- Q1 2010: +4.9 pct, 15 one percent days
Comment: a delayed fiscal policy response to the Financial Crisis contributed to especially high volatility in Q4 2008 and Q1 2009. The Federal government did not pass the landmark recovery bill ARRA until February 2009, one month before the market troughed.
Takeaway: the average performance of the S&P 500 in the first quarter following the 6 years with especially volatile returns (+100 one percent days) was negative 0.2 pct, but the dispersion of returns was wide (anywhere from negative 12.1 pct in Q1 2001 to positive 21.6 pct in Q1 1975). Volatility also remained elevated, registering an average of 27 one percent days or about double the Q1 average of 13 over the last +6 decades.
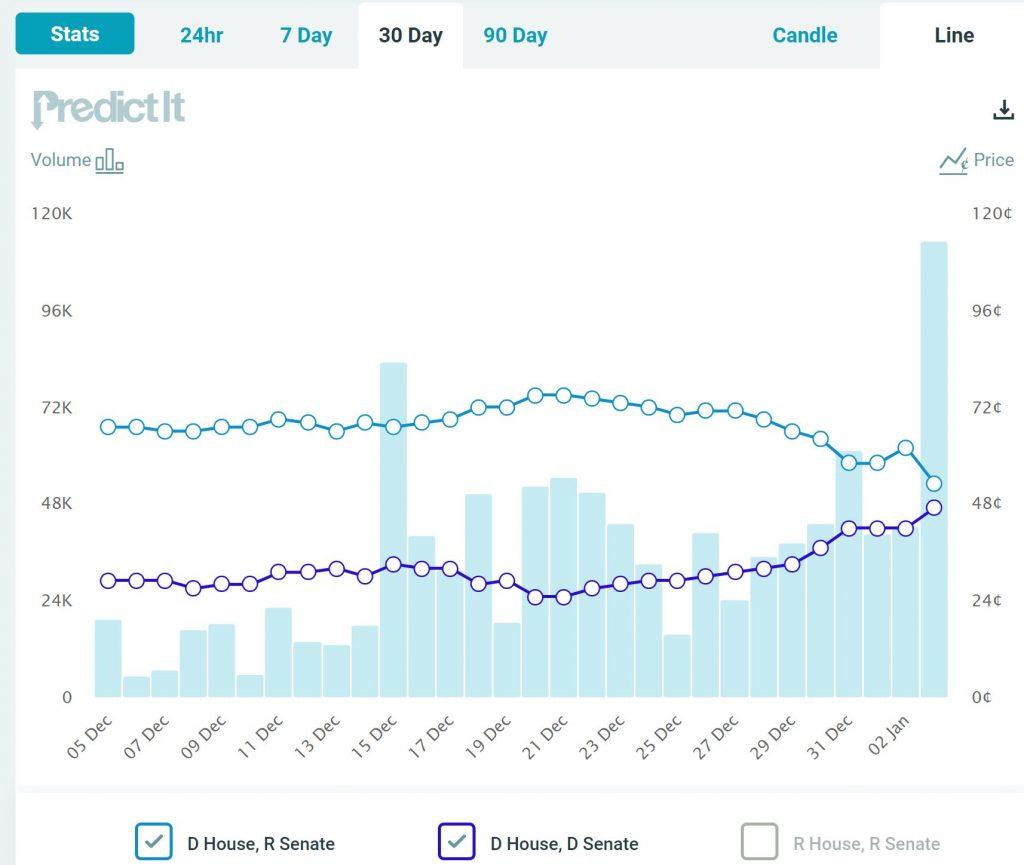
As for what all this means for Q1 2021, we are seeing above-average volatility carry over into the New Year (totally normal), but the current setup is unique relative to the prior three periods we outlined. For example, we don’t know which party controls the Senate given 2021’s unusual Georgia runoff elections tomorrow. PredictIt.org – a website that allows users to place small-money wagers on various political outcomes – shows the odds of Republicans maintaining a majority in the Senate narrowed sharply this past weekend. Below is a graph for the contract: “What will be the balance of power in Congress after the 2020 election?”
-
Odds for a Democratic House and Republican Senate are down to 52 pct as of today versus 62 pct just two days ago. They had been comfortably above 65 pct until the last few days.
-
Odds for a Democratic House and Democratic Senate are now up to 46 pct versus just 25 to 33 pct for most of December.
Bottom line (1): markets had been discounting a Republican majority in the Senate especially after the GOP unexpectedly gained new seats in the House during the November elections. While Democrats taking back the Senate could lead to more stimulus, it may also result in less business-friendly corporate/individual tax policy and regulation. This uncertainty is what largely contributed to the selloff to start the New Year today, and we expect more volatility ahead should markets have to adjust its expectations if Republicans lose the Senate in tomorrow’s elections.
Bottom line (2): US market history very clearly shows that volatility does not return to normal levels until long after a market crisis has occurred. We still expect 2021 to produce reasonable equity returns, but with what many might consider unreasonable volatility.
Tyler Durden
Wed, 01/06/2021 – 06:00![]()
Zero Hedge’s mission is to widen the scope of financial, economic and political information available to the professional investing public, to skeptically examine and, where necessary, attack the flaccid institution that financial journalism has become, to liberate oppressed knowledge, to provide analysis uninhibited by political constraint and to facilitate information’s unending quest for freedom. Visit https://www.zerohedge.com