“Mind-Boggling Liquidity”: Nobody Is Paying Attention To The $1.1 Trillion Flood About To Hit Markets
Amid the ongoing Reddit short squeeze drama which had traders glued to their trading terminals for much of the past two weeks, quite a few may have missed the biggest news of the past week which was the publication of the Treasury’s latest Borrowing forecast, according to which the US expects to borrow just $275BN in the current quarter, down a whopping 75%, or $853 billion, from its November 2020 projection of $1.127 trillion.
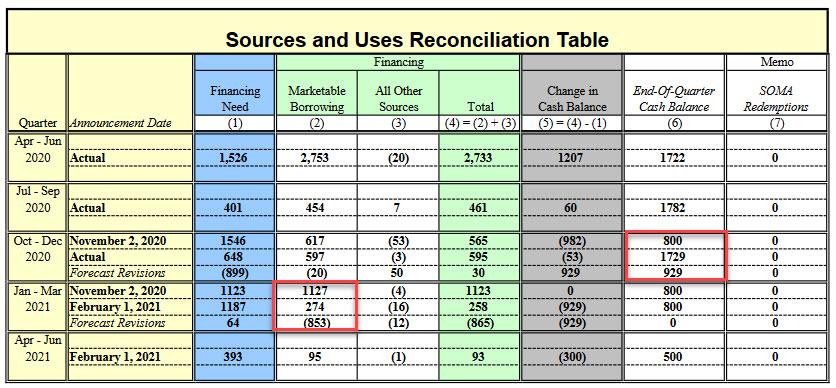
The reason for this plunge in funding needs is because the Treasury now expects that it simply won’t need to borrow as much debt as the end-of-March cash balance held in the Treasury General Account (TGA, which is simply the Treasury’s cash balance held at the Fed) would plunge to just $800 billion, down a record $929BN from $1.729 trillion at Dec 31, 2020 (as an aside, the reason why the cash was so high as year end is because the Treasury never got around to actually disbursing the latest stimulus package in December, and it’s also why as the Treasury said “the decrease in privately-held net marketable borrowing is primarily driven by a higher beginning-of-January cash balance as a result of lower-than-assumed expenditures.”)
In other words, had Trump used up roughly $1 trillion in cash the Treasury had previously budgeted for spending on fiscal stimulus, there would be no surprises today, and instead of the cash balance dropping to $800BN in this quarter, it would have done so last quarter (we discussed this last November in “The 2021 Liquidity Supernova: Step Aside Fed – US Treasury Will Unleash $1.3 Trillion In Liquidity“). Instead, the Treasury now expects the decline in the cash balance this quarter – which is being spent to fund last December’s fiscal stimulus – to be the main driver of funding needs.

It doesn’t end there, because one quarter later, the Treasury expects to borrow just $95BN – the lowest in two years quarters – and finish the June quarter with a cash balance of only $500BN, a reduction of $300BN for the quarter, the lowest in six quarters and less than 30% of the average cash balance at the end of the latest three quarters ($1.74BN).
Looking beyond that, we have to go back to an analysis we put together back in November, which cited calculations from Morgan Stanley, according to which unless the debt ceiling deadline – which this year falls on Aug 1, 2021 – is extended well in advance, starting on this date, the US Treasury will not be able to issue any additional debt above and beyond what it needs to cover existing debt obligations. However, what few may be aware of, is that there is a clause written into the law that prohibits the TGA from rising above levels prior to the debt ceiling deadline, which was in 2019.
This means that based on the 2019 debt ceiling, the Treasury cash will need to fall even more, down to just $200 billion by August 1, and as the chart from MS below shows, depending on the upcoming political fight over the debt ceiling, it could end up being quite a mess.
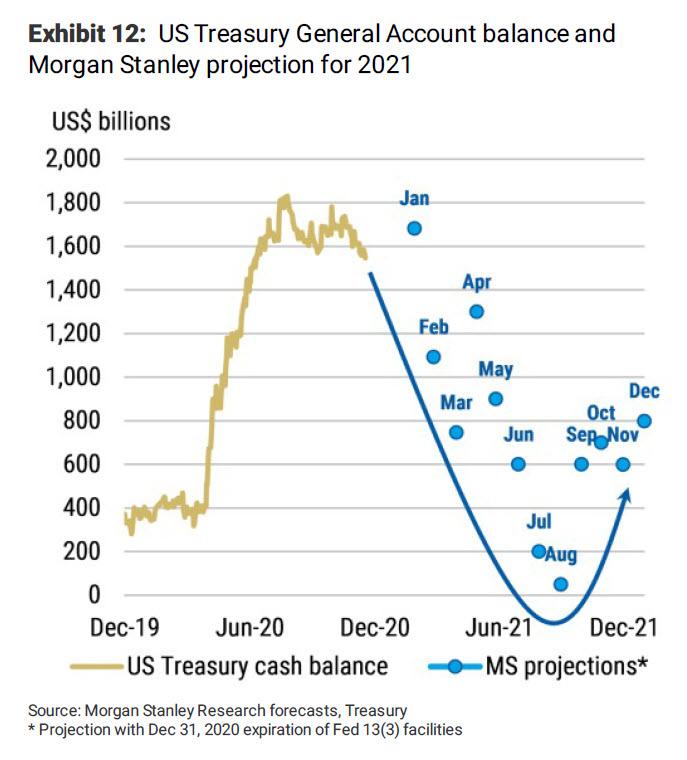
Said otherwise, the market is about to see a flood of $800BN in extra liquidity over the next 6 weeks, and a total of $1.1 trillion in the next 10 weeks, and then potentially another $300 billion in the subsequent two months. With the TGA cash currently at just under $1.6 trillion, it means that the US Treasury may unlock as much as $1.4 trillion in liquidity over the next 6 months, nearly 50% more than the liquidity coming from the Fed over the same time period which will be roughly $620 trillion ($120 x 6 months)!
This, not too put it lightly, is a huge deal with major market implications (and is why three months ago we said to “buy everything ahead of an unprecedented dollar devaluation orgy” simply based on this analysis).
First, recall that one of the early (and completely false) reasons cited for the Sept 2019 repo crash, was the modest spike in Treasury cash balances around that time, which also resulted in substantial reserve drain among banks (mostly JPMorgan) which were desperate for more QE. As a result, we almost immediately got “NOT QE” (which, of course, was absolutely QE) and hundreds of billions of reserves were injected into the system by the Fed but not before markets had to tumble to spur the Federal Reserve into acting.
Well, what is happening now is just the opposite and many, many times bigger, as almost one trillion reserves are about to be injected into the system as cash is drained from the Treasury’s account at the Fed. As we said on Monday, “as Treasury cash balances plunge, banks will see their reserve levels soar by roughly $900 billion this quarter, a move that will lead to significant risk asset upside if previous instances of reserves growth are any indication.”
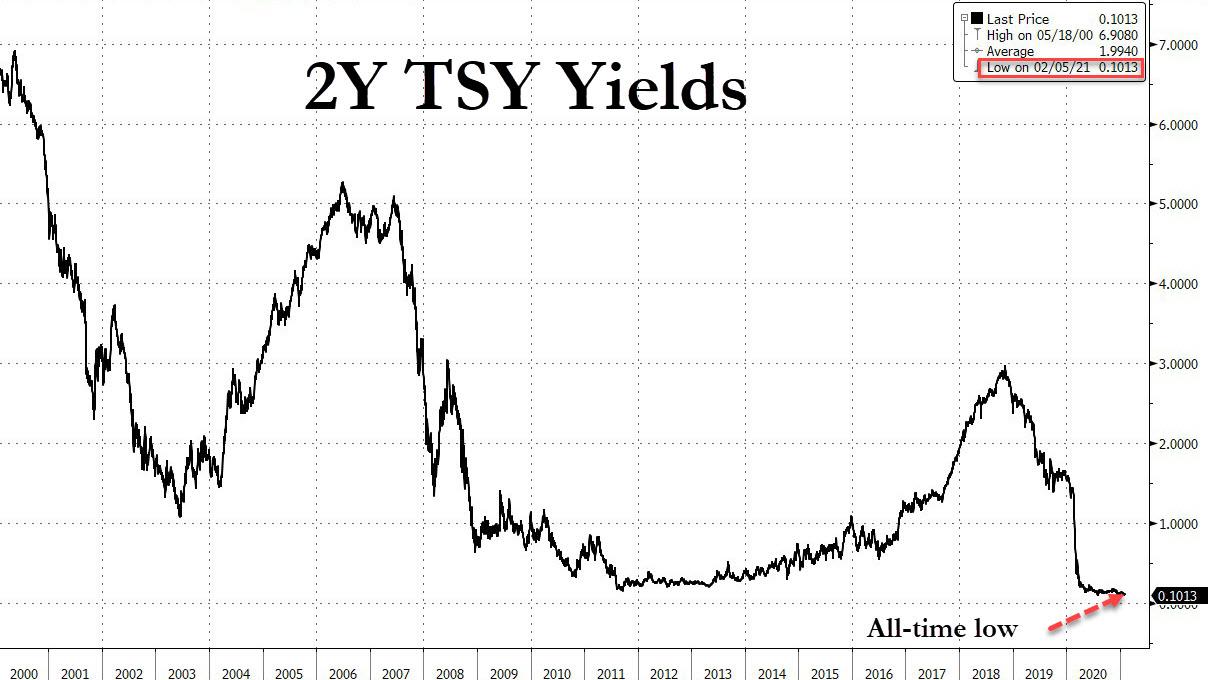
Second, there are major implications for the rates market where the recent flood of bill issuance is set to hit a brick wall: as we said on MOnday, the plunge in short-term debt (Bill) issuance – since there will no longer be an urgent need to keep cash balances in the $1+ trillion range – will compress short-term spreads (effective FF through 3M) to zero – or even negative – as there is suddenly a flood of liquidity which could prompt the Fed to engage the fixed-rate borrowing facility or even nudging the IOER higher. Indeed, on Friday we saw just this move as the 2Y TSY dropped to the lowest yield on record.
Those looking for more details can read our November preview of this event (“The 2021 Liquidity Supernova: Step Aside Fed – US Treasury Will Unleash $1.3 Trillion In Liquidity“), or read the below explanation from Larry McDonald, author of The Bear Traps Report, who last week put together an exhaustive summary of the implications of the TGA plunge.
Again What is the TGA? The US Treasury’s General Account
The TGA is the mechanism through which Treasury makes payments. It’s the checking account through which the government makes all its payments. This checking account is located at the Federal Reserve Bank of New York. It’s where tax payments are deposited and where funds from Treasury debt auctions are collected. So when the TGA changes, that affects deposits at the Federal Reserve. Ultimately, monetary policy, and Quantitative Easing, is conducted through the TGA. It’s important. Of course, last year the TGA grew. It moved up from its usual range of $300 million/$500 million to, since May, well over $1 trillion. The thought had been that $1 trillion would be released into the economy to stimulate it prior to the November election. Didn’t happen. Congress stalled.
Go Big or Go Home?
Enter “Go Big or Go Home” Yellen. What’s she gonna do now? There will be another Covid relief bill of some kind. She’ll be the one cutting the checks through the TGA. This will release money out of the TGA and that means there will be a lot more money in the system. Yellen has $1 trillion burning a hole through her pocket. Additionally, QE is pumping money in at $120 billion clips a month. The combo of a near $1 trillion check and $120 billion monthly QE is the monetary equivalent of eating a banana split after downing an Italian hero sandwich. The market will be stuffed with reserves.
The money will in part be put into the short end of the curve (already anticipated as we can see in super low LIBOR recently, and low T-Bill yields etc.). Some of the tidal wave of money will find its way into stocks and commodities. Some will find its way to higher prices for goods and services. This is the mirror opposite of 2018/2019 when traders fretted that treasury issuance would overwhelm their desks. This led to higher rates and a higher dollar… The 2019 events drama reached its September 2019 climax when the Fed was forced to introduce QE light. What an embarrassment, after pounding the table for 2 years on the wonders of committed balance sheet REDUCTION, up to $50B a month in Q1 2019, they reversed 2x. First in January 2019 by stopping the expansion, THEN again in September 2019 by restarting QE. Reflation assets (EM, global cyclicals ripped higher from Sept to the start of Covid risk in Feb 2020). Both times the beast inside the market reversed the academics at the Fed. Traders > educators in this case.
So now there will be mind-boggling liquidity, no vig in the front end, and a weaker dollar to boot. Nothing is guaranteed when it comes to fiat currencies, but fiat currencies are in a race to the bottom. Given the upcoming drawdown of the $1 trillion in the TGA , it’s a race the US is likely to win.
Recap with more Complexity, Digging Deeper
One of the questions hanging over asset markets going into 2021 was what would happen to the TGA account. The TGA is the Treasury’s General Account which is how the Treasury makes payments. As we saw last year, the TGA was built up to levels much higher than they traditionally get to. In the past, the level of the TGA has traditionally been between $300-500 billion. Currently, and pretty much since May of last year, the TGA has been over $1 trillion, which is well above its historical norm.
Going back to Q3 of 2020 there was a lot of speculation that the previous administration would use the massive levels of TGA to get more stimulus into the economy before the elections in November. However, that never really transpired and more covid relief was not passed by congress until after the election.
This setup the question for Secretary Yellen in terms of how she would manage the TGA, especially into the likelihood of another covid relief bill. The market has gotten its answer as Yellen and the Treasury plan to draw down the TGA balance back to more historical levels. The consequences of this are simple, a lot more reserves in the system. The combination of Fed QE running at $120 billion a month and around a trillion-dollar drawdown in the TGA level means that the levels of reserves in the system will be massive.
The combination of less short term issuance and massive QE will continue to put pressure on front end yields. This has been seen in very low LIBOR settings, low T-bill yields, and a lower setting in the effective fed funds rate. This pressure on the front end will continue to come especially in light of less front end issuance as the Treasury draws down their TGA balance.
The market in the first quarter of this year is basically setting up for the inverse of 2018/2019, where funding markets have begun to get stretched. The story in 2018/19 was that Treasury issuance would overwhelm the market and lead to this crowding out of assets as dealers had to move funding to take down treasuries. Now, the problem is flipped. There are so many reserves in the system already from the Fed’s QE, and now it is going to get another increase via the TGA. So if 2018/19 was the story of issuance crowding out the market and putting pressure on funding markets which led to a higher dollar, this rendition could lead to the opposite.
With that said, we think the correlation between net issuance and asset prices is a bit overstated. Yes, there will be a ton of liquidity on the back of these moves from Treasury, but in terms of marginal drivers, it will matter most in funding markets and the front end of the treasury curve. The other part of this is, this UST funding announcement doesn’t include the impact of whatever $1.9tln will come from the White House and congress.
Overall: the story is that reserves are everywhere and more are coming. In theory, over the near term, we are setting up for an inverse of 2018/19, which means front-end yields, funding markets etc. will be flushed and liquidity in the system will be at very high levels.
So while the bullish case is clearly there – after all a $1.1 trillion reserve injection all but assures higher risk prices, the only question is by how much, some – such as JPM’s Nick Panigirtzoglou – have taken on a more hedged position, even though even the JPM admits that a $800BN spike in reserves in just two months would be a major market event…
- The US Treasury signaled this week a strong intention to reduce its Treasury General Account (TGA) balance at the Fed, from its current level of close to $1.6tr to $500bn by mid-2021.
- Such a sharp decline would mechanically bolster the liquidity in the US banking system, i.e. the amount of reserves, by $1.1tr by mid year
… noting that “a halving in the TGA in just under two months would be a significant decline, in particular given the slow conversion of PPP loans to grants thus far with just over $100bn converted between October and mid-January.”
Yet within this broader tidal wave in reserves, Panigirtzoglou believes that the immediate impact will be relatively modest, and explains why below, first focusing on his view of narrow vs broad liquidity “plumbing” dynamics in the market (which differ substantially from those of repo god Zoltan Pozsar so take them with a giant grain of salt)…
What are the implications for liquidity from a prospective large reduction in the TGA balance over the coming months? We argued before that liquidity should be split into two different components: 1) narrow or banking sector liquidity, which is created by the injection of excess reserves into the banking system; and 2) broader liquidity or money supply, which is the amount of cash or deposits held by the non-bank sectors of the economy such as households, non-financial corporations and financial intermediaries such as asset managers, pension funds and insurance companies. This broad liquidity is in turn primarily a function of QE related purchases by central banks and bank lending to the real economy by commercial banks. In general, these two components of liquidity are interrelated but are not necessarily mechanically linked and are thus distinct. For example, QE bond purchases, by injecting reserves into the banking system, increase narrow liquidity, but they do not necessarily increase broad money supply. Bond purchases can result in an increase in money supply either directly, e.g. if the central bank buys bonds from a non-bank entity such as a pension fund, this automatically expands the assets (reserves) and liabilities (deposits) of the banking system; or indirectly, when central banks’ quantitative measures induce higher bank lending in the economy.
… and then expands this analytics framework to how $1.1 trillion in reserves will impact assets:
A sharp decline in the TGA balance and the resulted $1.1tr increase in the stock of reserves in the US banking system would bolster banking sector liquidity i.e. narrow liquidity but will have no direct implications for broad liquidity, i.e. the cash balances of non-bank investors as captured by money supply. This is because a decline in the TGA balance would have no overall impact on the size of commercial bank’s balance sheet as it would effectively replace government debt with reserves in commercial bank’s asset side and TGA balances with reserves in the Fed’s liability side. These reserves or narrow liquidity reflect the amount of reserves commercial banks have with central banks in excess of what they would need to meet usual liquidity needs. Given that the banking system cannot get rid of reserves in aggregate, these zero yielding reserves become the “hot potato” that banks try to pass to other each until the relative pricing across money market instruments is adjusted enough to remove the incentive for banks to get rid of these reserves. In other words, narrow liquidity tends to reverberate within the money market space and suppress yields at the front end of the yield curve with little implication for the longer end of the yield curve or other asset classes such as equities.
Needless to say, we completely disagree here and merely bring up the historical record: the Sept 2019 repo crash first spiked a violent market correction and only then did the Fed conceded to inject more liquidity. It stands to reason that the equity response now will be the opposite as we are now facing a mirror image of the liquidity picture in 2019. In any case, going back to the JPM quant:
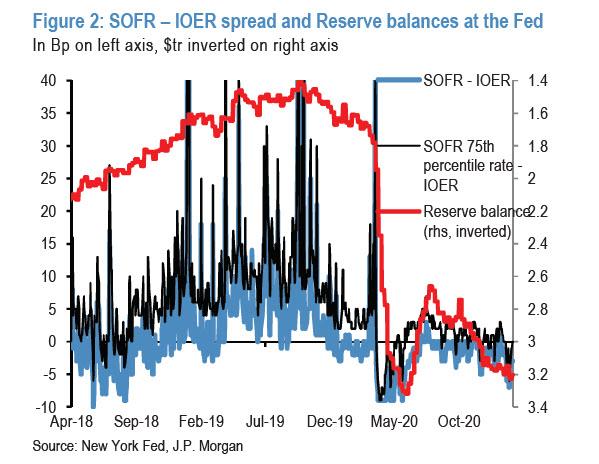
But even with the money market space, given the US banking system is already flooded with $3.2tr of reserves, well above a neutral level which we envisage at below $2tr, an additional $1.1tr of reserves would not make much difference in the current conjuncture. Indeed, after the sharp increase in reserves during 1H20, volatility in Fed funds – IOER spreads and SOFR – IOER spreads have already significantly reduced (Figure 2). The additional injection is likely to put some downward pressure on these rates to grind toward the zero lower bound of the Feds funds target range, supporting somewhat demand for shorter-dated Treasuries as banks seek some yield and duration. However, our projections for the global bond supply-demand balance in 2021 already incorporated only a relatively modest deterioration in G4 commercial bank demand from last year’s record levels.
Summarizing JPM’s view, we find it surprisingly restrained in its optimistic assessment…
In all, we see little impact from a prospective TGA balance reduction on broad liquidity and thus on other asset classes outside money markets or the front end of the UST yield curve. And the actual path of the TGA decline may differ from the Treasury’s forecasts not least as they do not potential additional fiscal stimulus into the projection.
… then again it comes from the same JPM analyst who has been desperately trying to talk down bitcoin for the past 4 months, most recently just two weeks ago. Well, with bitcoin hitting $41,000 this morning and all other cryptos at all time highs, not only have those who listened to Panigirtzoglou worse off, but maybe Nick has become the “big JPM fade”. In any case, we are confident that it is only a matter of time before his Croatian colleague, the permabullish Marko Kolanovic takes the other side of the euphoria trade from Panigirtzoglou… as would we by the way.
In any case, with $1.1 trillion about to hit the market, perhaps now is not the time for nuance and instead a more shotgun approach is appropriate, which is why we like Larry McDonald’s take as it cuts to the chase, and more importantly, is correct:
The combo of a near $1 trillion check and $120 billion monthly QE is the monetary equivalent of eating a banana split after downing an Italian hero sandwich. The market will be stuffed with reserves.
Of this we are certain. What does remain an open question is at what S&P level – 4,000? 4,500? moar? – will the Fed finally realize what it and the Treasury have done, and intervene by warning markets that it is about to pull its pedal off the gas, especially with a chorus of dovish, establishment progressive economists such as Larry Summers and Olivier Blanchard now warning that a $1.9 trillion stimulus could overheat the economy (yes, democrats warning of such a thing as too much stimulus – now we’ve seen it all). In fact, the next big risk is increasingly shaping up as a hawkish reversal by the Fed some time around July/August, when the Treasury cash balance tumbles to $200BN or so and when the S&P is in the the low to mid-4000s…
Tyler Durden
Sat, 02/06/2021 – 15:04![]()
Zero Hedge’s mission is to widen the scope of financial, economic and political information available to the professional investing public, to skeptically examine and, where necessary, attack the flaccid institution that financial journalism has become, to liberate oppressed knowledge, to provide analysis uninhibited by political constraint and to facilitate information’s unending quest for freedom. Visit https://www.zerohedge.com