These Are The ‘Greenest’ Countries In The World
From widening wealth disparity to the environmental ramifications of economic development – the growing focus on global sustainability is a clear sign of the times.
Research reveals that when a sustainable ethos is applied to policy and business, it typically bodes well for economies and people alike. By providing benchmarks for those decisions, indexes like Yale’s Environmental Performance Index (EPI) can be critical to measuring national sustainability efforts.
As Visual Capitalist’s Therese Wood details, the below map interprets the EPI ranking of 180 economies across 32 environmental health indicators by narrowing in on the top 40 greenest countries.
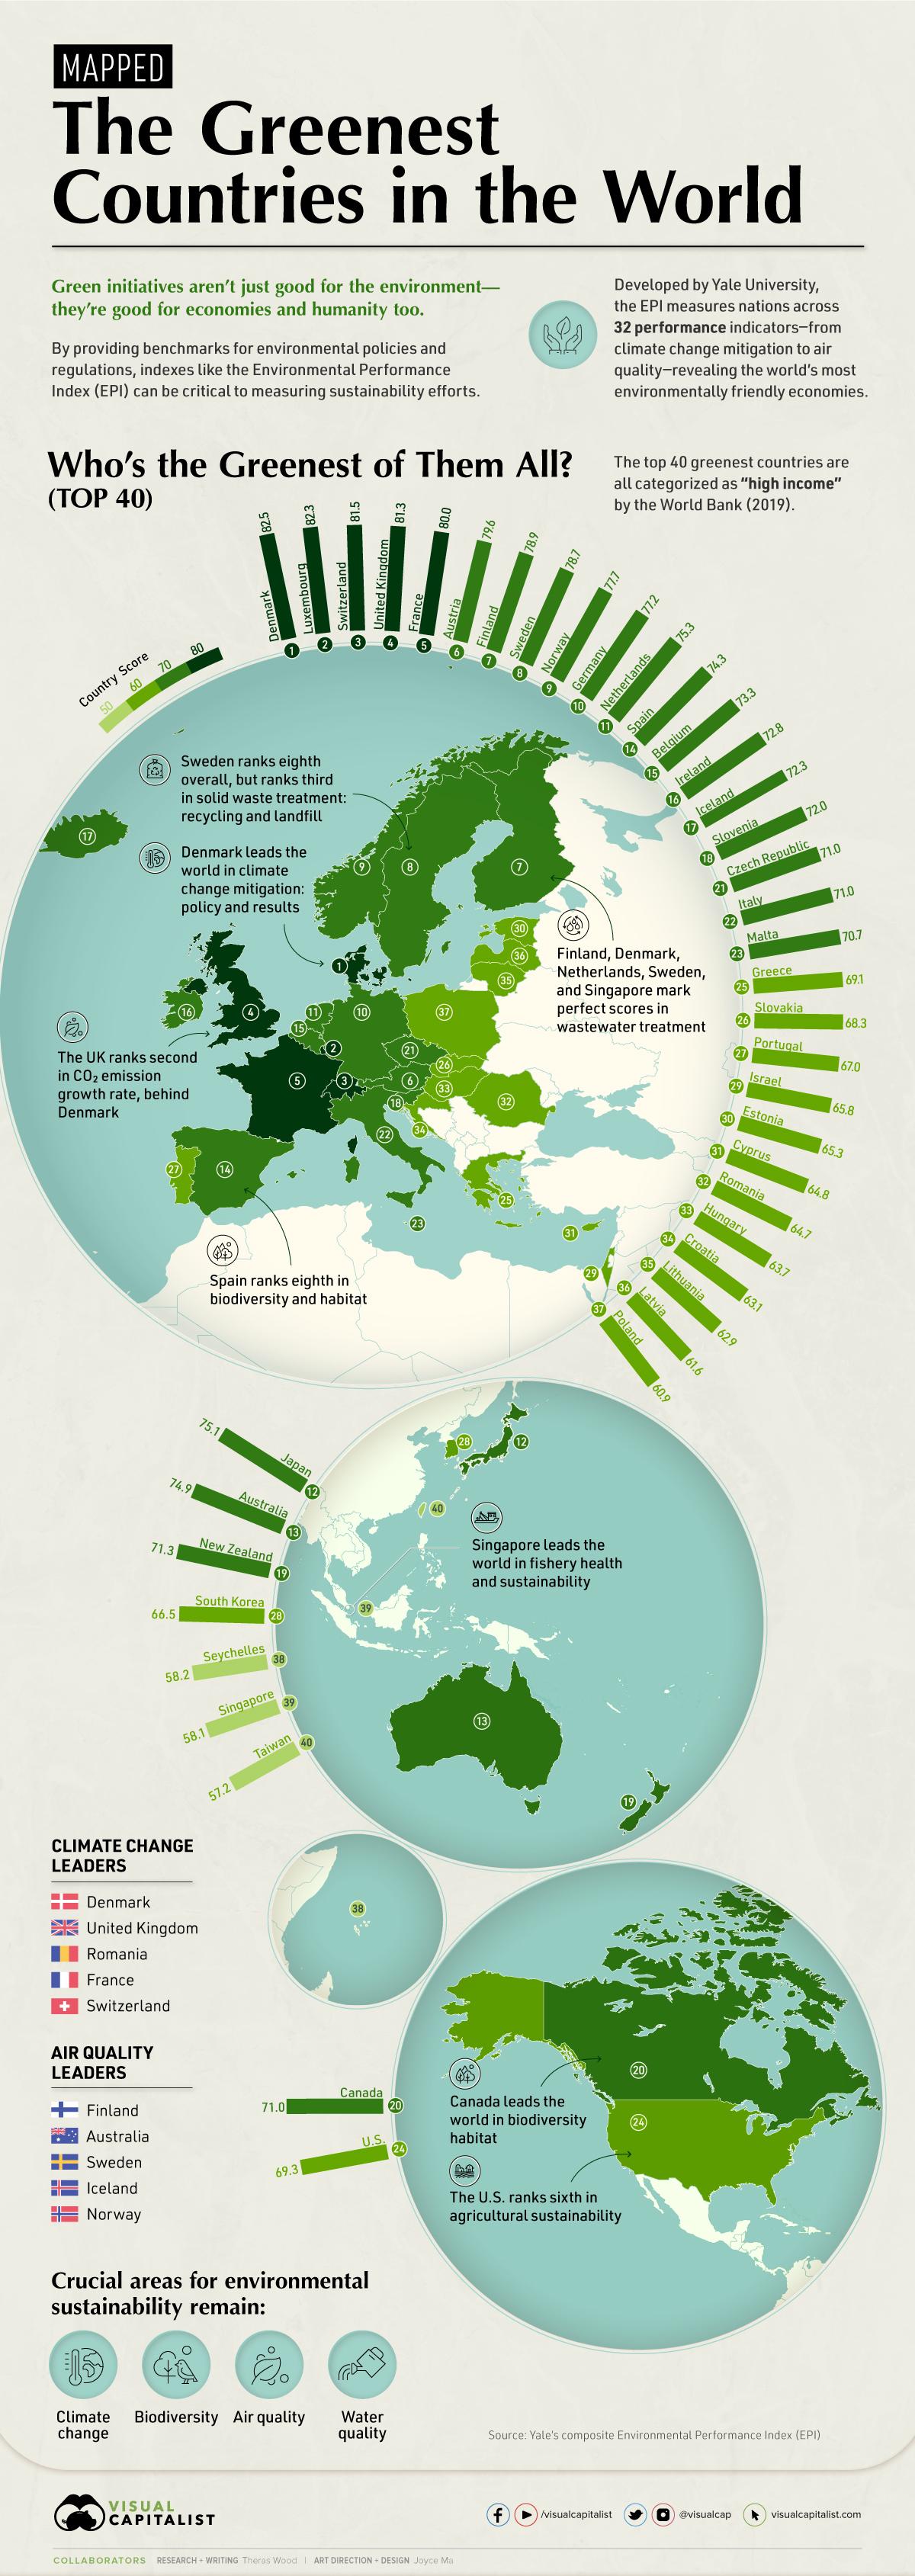
Who’s the Greenest of them All?
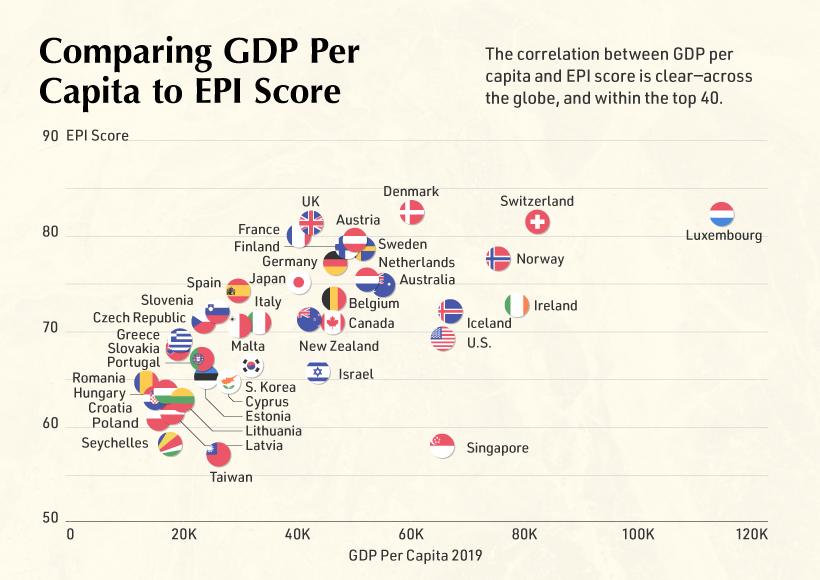
Despite the decades-long trend of globalization, national environmental policies have proved to be widely divergent. The EPI report confirms that those policies—and their positive results—are highly correlated with national wealth.
This is evidenced in the global EPI distributions, seen below:

Regional grouping in the report include: Global West, Asia-Pacific, Eastern Europe, Former Soviet States, Greater Middle East, Latin America & Caribbean, Southern Asia, and Sub-Saharan Africa
Scandinavian countries, which tend to have a high GDP per capita, show strong and consistent results across EPI parameters. Denmark for instance—which ranks first overall—leads the world in slowing its growth in CO2 emissions. Meanwhile, neighbor Sweden leads in landfill and recycling treatment, while wastewater treatment is led by a handful of countries within and beyond Scandinavia including Denmark, Finland, the Netherlands, Singapore, and Sweden.
In North America, Canada claims top spot in the biodiversity and habitat category, while the U.S. ranks sixth in agricultural diversity globally. In Asia, Singapore leads the world in fishery health and sustainability.
Ultimately, it appears the world’s greenest countries tend to focus on all areas of sustainability, while laggard countries show more uneven performance across categories.
What Does “Green” Mean?
Each high-level performance indicator with the EPI, like “environmental health”, is broken into subsections. Nations are scored on each subsector on a scale up to 100. As a result, multiple countries can rank first in any given category.
By evaluating national sustainability on a scale that is unrelated to other nations, we get a clearer idea of comparative national progress, beyond a basic ranking.
For instance, 30 countries tie for first in marine protection, all with scores of 100. This shows that many economies are prioritizing this area of sustainability.
The EPI categories and subsectors are shown in the diagram below:

Each section is weighted differently, and is reflected as a percentage within the index. For example, Ecosystem Vitality accounts for 60% of the EPI, Climate Change makes up 24% of a country’s score, and CO2 emission reduction is weighted at 13.2%.
The Cost of Being Green
Infrastructure costs are one reason why wealthier nations tend to fare better across sustainability measures. Everything from air pollution reduction and water treatment, to hazardous waste control and mitigation of public health crises are especially expensive—but have a huge potential impact on citizens.
This trend can be seen the scatterplot, which demonstrates the distribution of economies evaluated by the EPI:
For a more detailed look, the table below highlights the GDP per capita of each of the top 40 greenest countries, based on data from the World Bank and Statista:
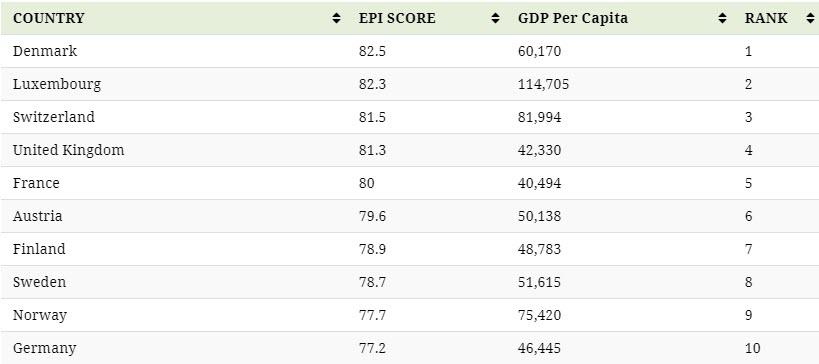
Despite the strong correlation between GDP per capita and EPI score, developing countries do not have to abandon sustainability efforts. China for instance leads the world in the adoption of electric vehicle technology.
Post-Pandemic Outlook
Although some rankings can seem prosaic, indexes like the EPI provide a helpful benchmark for economies to compare efforts. It also allows governments to iterate and build upon environmental strategies and investments by highlighting what is and isn’t working.
CO2 emissions, for instance, are a major driver of climate change. Although the global economic stall has led to a temporary dip of CO2 emissions in early 2020 (a slower growth rate than the 11% expected rise), global emissions still continue.
However, the EPI shows that investments have impact. High-level sustainability efforts—political commitment, media coverage, regulations—can deliver results, even at the grassroots level.
Tyler Durden
Mon, 03/08/2021 – 02:45![]()
Zero Hedge’s mission is to widen the scope of financial, economic and political information available to the professional investing public, to skeptically examine and, where necessary, attack the flaccid institution that financial journalism has become, to liberate oppressed knowledge, to provide analysis uninhibited by political constraint and to facilitate information’s unending quest for freedom. Visit https://www.zerohedge.com