
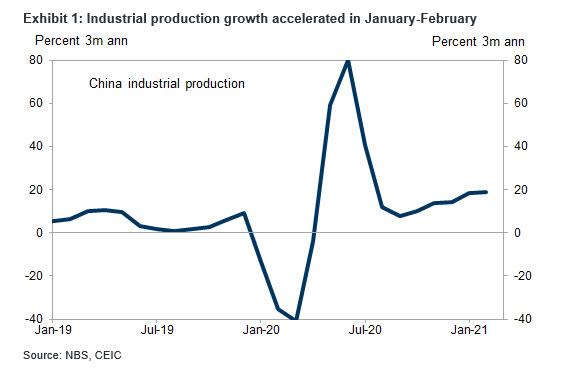
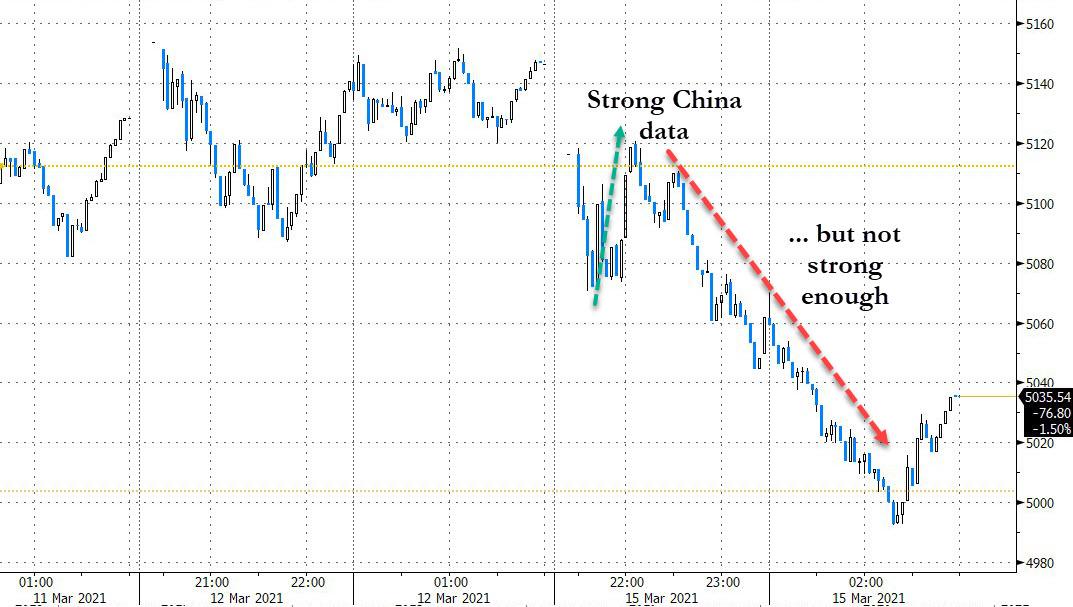
Chinese Markets Slump Despite Soaring Industrial Production, Retail Sales
Chinese stocks fell, starting the week off on the back foot despite solid January-February economic data which showed surging industrial production and retail sales growth stronger than market expectations, although weaker-than-expected investment growth and higher unemployment point to an uneven recovery (Goldman noted that it expects the strength in export growth to continue supporting manufacturing activity, and services and consumption should recover further as the local outbreak of coronavirus was brought under control).
Here are the key numbers:
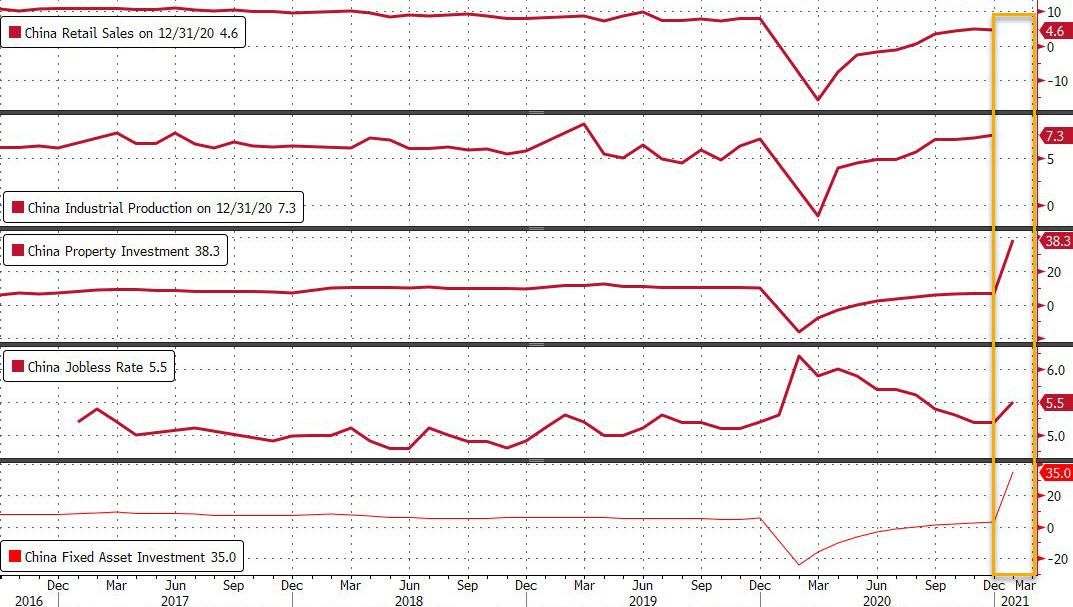
- Industrial production (IP): +35.1% yoy in January-February beating the Bloomberg consensus: +32.2% yoy). December: +7.3% yoy
- Retail sales: +33.8% yoy in January-February (GS: +35.0% yoy, Bloomberg consensus: +32.0% yoy); December: +4.6% yoy.
- Fixed asset investment (FAI): +35% ytd yoy in January-February (GS: +40.0% yoy, Bloomberg consensus: +40.9% ytd yoy); December single month: +5.1% yoy.
- Unemployment rates (nationwide): 5.4% in January-February, vs. 5.2% in December.
- Unemployment rates (31 major cities): 5.5% in January-February, vs. 5.1% in December.
Property-related data:
- Floor space sold: +104.9% yoy in January-February, vs. +11.5% yoy in December (value of sales: +133.5% yoy, vs. +18.9% yoy in December).
- Floor area under construction: +11.0% yoy in January-February, vs. +3.7% yoy in December.
- New starts: +64.3% yoy in January-February, vs. +6.3% yoy in December.
- Completions: +40.4% yoy in January-February, vs. -0.2% yoy in December.
- Real estate investment: +38.3% yoy in January-February, vs. +9.3% yoy in December.
Some further observations on the data from Goldman:
1. Year-over-year growth in activity data accelerated materially in January-February on the back of the very low base last year. IP increased 35.1% yoy on the back of the strength in export growth. Production of computers/electronics, electrical machinery and autos were the major drivers of IP acceleration in January-February vs December (Exhibit 2).

2. Fixed asset investment (FAI) growth was below market expectations in January-February. Property investment rose 38.3% yoy in January-February (vs. 9.3% in December). Manufacturing investment was up 37.3% yoy in January-February (vs. +6.9% yoy in December). Infrastructure investment increased 35.9% yoy in January-February.
3. Retail sales growth was above market expectations in January-February. Automobile sales jumped to 77.6% yoy from 6.4% yoy in December. Catering sales rose 68.9% yoy in January-February (vs. +0.4% yoy in December). Overall, online goods sales outperformed in January-February: rising 30.6% yoy vs. 33.8% for total retail sales despite +3.0% yoy in last January/February vs. -21.1% for total retail sales. Online goods sales growth (included in total retail sales) rose +30.6% yoy in January-February from +7.3% yoy in December. On a real basis, retail sales growth in January-February rose 34.3% yoy, vs 4.9% yoy in December. The Services Industry Output Index, which is on a real basis and also tracks tertiary GDP growth closely, rose +31.1% yoy in January-February (vs. +7.7% yoy in December; average annual growth +6.8% yoy in January-February 2020-21).
4. Property sales volume surged 104.9% yoy (vs. +11.5% in December) and housing completions rose 40.4% yoy in January-February (vs. -0.2% in December) on a low base. Retail sales data suggest furniture sales and home appliances accelerated to 58.7% and 43.2% yoy, respectively, in January-February (vs. +0.4%/11.2% in December), in line with growth in completions. Housing starts grew +64.3% yoy in January-February from +6.3% in December and building material sales rose by 52.8% yoy (vs. +12.9% in December).
5. Unemployment levels rose in January-February partially due to Chinese New Year seasonality: The nationwide survey-based unemployment rate rose by 0.2pp to 5.4% in January-February, and the 31-city surveyed unemployment rate rose to 5.5%, though the levels are still below the average nationwide survey-based unemployment rate of 5.6% in 2020.
* * *
In sum, China’s economic activity data showed strong acceleration in year-over-year terms on a very favorable base effect. In sequential terms, industrial production remained strong in the first two months of the year, but retail sales and fixed investment appeared to still be lagging behind. Looking ahead, Goldman expect the strength in export growth to continue supporting manufacturing activity, and services and consumption should recover further as the local outbreak of coronavirus was brought under control. Based on the historical relationship, the January-February IP and service output index suggest some upside risk to Goldman’s Q1 GDP forecast of 17.3% yoy.
In response to the data, China’s CSI 300 initially rebounded from an early drop only to decline again, sliding almost 2%. The ChiNext Index tumbled more than 3.5%. The Hang Seng Index gained 0.6%, propelled by Xiaomi after a U.S. court blocked the Defense Department from restricting American investment in the Chinese smartphone company. Tencent dragged on the index after a report on China’s increased scrutiny of its finance-related businesses.
Tyler Durden
Mon, 03/15/2021 – 07:28![]()
Zero Hedge’s mission is to widen the scope of financial, economic and political information available to the professional investing public, to skeptically examine and, where necessary, attack the flaccid institution that financial journalism has become, to liberate oppressed knowledge, to provide analysis uninhibited by political constraint and to facilitate information’s unending quest for freedom. Visit https://www.zerohedge.com