US Existing Home Sales For March Will Decline More Than Expected
Authored by Christophe Barraud,
Later this morning, the National Association of Realtors (NAR) will release the US Existing Home Sales (EHS) for March. According to the Bloomberg consensus, EHS should decrease by 1.1% MoM to 6.15 million SAAR. It would be the lowest level since August 2020.
EHS will decline more than expected because of technical and fundamental factors:
-
Buyers signed contracts in February (and to a lesser extent in January) for most March sales. Therefore, March EHS were still affected by adverse weather conditions.
-
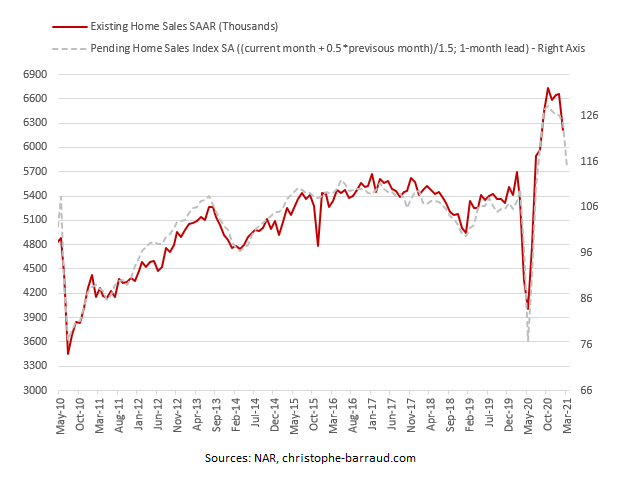
A larger fall than forecasted would be coherent with the trend in Pending Home Sales (PHS).
-
Local/state reports show that, on a YoY basis, sales rose at a faster pace in March (non-seasonally adjusted: NSA) due to calendar and positive base effects. Ajusting for these biases, it resulted in a drop on a MoM basis (seasonally adjusted: SA).
-
Demand was dampened by a deterioration of housing affordability amid higher mortgage rates and prices.
-
Lack of supply kept weighting on housing transactions.

1. Data construction implies that March figures were still affected by adverse weather conditions
Most of economists never looked at the construction of EHS data which explains a large part of miscalculation. According to the Census Bureau, “the majority of transactions are reported when the sales contract is closed. Most transactions usually involve a mortgage which takes 30-60 days to close. Therefore, an existing home sale (closing) most likely involves a sales contract that was signed a month or two prior.” In other words, most buyers placed their offers in February (and to a lesser extent in January), when weather conditions were unfavorable.
2. A decrease in Existing Home Sales would be coherent with the trend in Pending Home Sales
As the National Association of Realtors (NAR) noted, “The Pending Home Sales Index (PHS), a leading indicator of housing activity, measures housing contract activity, and is based on signed real estate contracts for existing single-family homes, condos, and co-ops. Because a home goes under contract a month or two before it is sold, the Pending Home Sales Index generally leads Existing-Home Sales by a month or two.” Therefore, it would be coherent if EHS catch up downward with PHS. However, note that EHS are unlikely to drop as much as PHS (down 10.6% MoM in February).
3. After seasonal adjustment, local/state reports confirm that sales fell in March
On a YoY basis, local/state figures suggest that national existing home sales (non-seasonally adjusted: NSA) are likely to have advanced again in March (9th straight rise). In addition, the pace of increase (NSA) was higher than in February (+8.7% YoY). This is not susprising given the positive base effect (EHS were weak in March 2020). The calendar effect was also supportive with one more business day in March 2021 compared to March 2020. Using my sample of local/state data and a seasonal adjustment factor higher than last year (less favorable), I expect March EHS to decline at a faster pace than anticipated by the consensus (-1.1%e MoM).
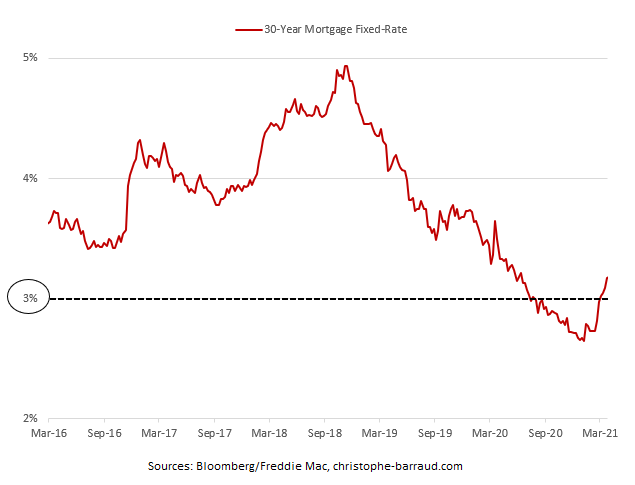
4. Demand was dampened by a deterioration of housing affordability
Housing affordability has been under pressure since January. On one hand, mortgage rates started rebounding with the 30-year recently hitting the highest level since June 2020 in late March.
On the other hand, prices kept climbing at a quick rate. In its February report, the NAR showed that “The median existing-home price for all housing types in February was $313,000, up 15.8% from February 2020 ($270,400), as prices rose in every region. February’s national price jump marks 108 straight months of year-over-year gains.” More recently, Redfin highlighted that, in March 2021, “The national median home-sale price hit a record high of $353,000, up 17% from 2020, a record high rate of growth.“
5. Lack of supply kept weighting on housing transactions
One of the recent development related to the the housing market has been the collapse in inventory, which pushed prices upward. My sample of local/state reports also pointed to a YoY fall in inventory that was larger than in February (-29.5% YoY). Note that several areas experienced a decline of more than 50%, such as in Minnesota (-54.8% YoY). This pattern was cited as a dampening factor on sales.
Tyler Durden
Thu, 04/22/2021 – 08:45![]()
Zero Hedge’s mission is to widen the scope of financial, economic and political information available to the professional investing public, to skeptically examine and, where necessary, attack the flaccid institution that financial journalism has become, to liberate oppressed knowledge, to provide analysis uninhibited by political constraint and to facilitate information’s unending quest for freedom. Visit https://www.zerohedge.com