What If Everyone Is Wrong About US Inflation’s Impact On Interest Rates?
By Nicholas Colas of Datatrek
Just one “Markets” topic today, but an important issue so it needs our full attention:
What if everyone is wrong about US inflation’s impact on interest rates? I (Nick) have never seen a stronger consensus around a macroeconomic topic in my +30-year career in finance. Fed money printing plus fiscal stimulus/debt issuance plus economic reopening is supposed to equal high and likely lasting inflation. The 10-year Treasury will go to at least 2 percent and maybe 3 percent or higher. And you can’t swing the proverbial dead cat without hitting even direr warnings …
But to paraphrase a bit of Yiddish wisdom: man plans, and markets laugh. The 2021 YTD high for 10-year Treasury yields was on March 19th, at 1.74 percent. Those broke 1.5 pct intraday today. And it is not just Treasuries turning their back on the global inflation narrative:
-
10-year German bund yields topped out at -0.11 percent in mid-May and are now -0.25 pct
-
10-year UK gilts hit a 2021YTD high in mid-May as well, at 0.89 pct, but are now 0.74 pct
-
10-year Japanese Government Bonds hit a 5-year high in late February 2021 at 0.17 pct but are now 0.08 pct
You really can’t blame central bank intervention for these moves. Their bond buying programs have been constant over the past several months.
Nor can a rational investor just shrug and say “Oh, well, I’m early on the inflation/rate call, but I will be proven right in the end.” Early is the same thing as wrong. When the market doesn’t go in the direction you expect while all the headlines are in your favor (and, boy are they ever…), you have to stop and reassess your point of view. There is nothing wrong with being wrong. Continuing to stay wrong when the market says you’re wrong is, however, not a great idea. At the very least, one has to stop and reassess.
So, what is really going on with Treasuries? Our answer is that this is a much more of a “show me” market than many investors may realize. It takes its lead from long-run historical precedent, not present-day data.
Consider this graph of 10-year Treasury yields (black solid line) and CPI headline inflation (red dotted line) from 1962 to the present:
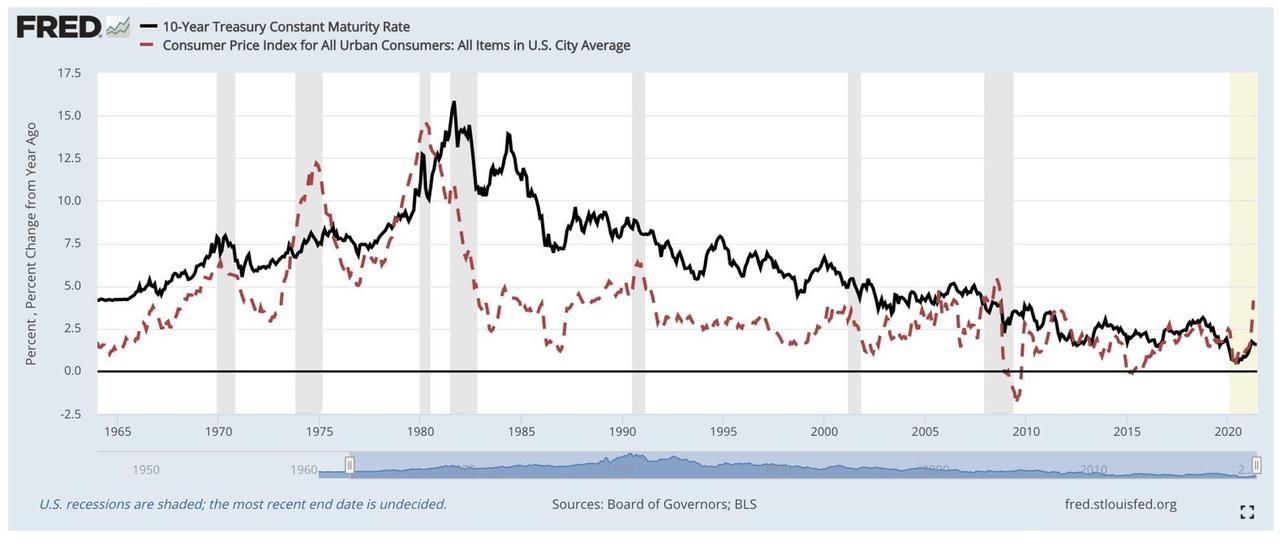
Here’s what we see:
-
The left third of the chart was a period of rising US inflation due to the Vietnam War, Great Society spending, and easy monetary policy. Yields rose, although not exactly in line with inflation. For example, they remained largely the same even as inflation spiked during the 1973 oil shock (second gray recession bar from the left).
-
The middle part of the chart, from 1981 – 2007, shows that 10-year yields remained far higher than underlying inflation for 26 straight years. For a market that many consider to be the most efficient in the world, that is a remarkable mismatch of pricing versus reality.
-
Only in the rightmost part of the chart do we see Treasury yields more often line up with current inflation, especially at the start (2010 – 2011) and end (2017 – 2019) of the last cycle. After +2 decades of declining inflation, Treasuries were finally convinced the 1970s were over.
The lesson here, which seems to be playing out right now, is that 10-year Treasuries anchor their inflation expectations around long-run trends rather than any year or two of CPI reports. This market didn’t fully believe inflation was structurally higher than then-current day levels during the 1960s/1970s. After that, it took more than 2 decades for it to believe inflation was sustainably in decline. And now, it is looking back at the last decade and yawning at all the chatter about post-pandemic inflation.
Could this time around be different? Sure but …
-
The burden of proof is actually in the inflation camp to explain why Treasuries will break with decades of history and pivot to believing one or two years of inflation data signal a change in structural US inflation.
-
That’s possible, and Fed bond purchasing tapering – whenever it comes – may temporarily lift rates.
-
But remember that after rising from 2 to 3 percent in 2013 during the “tantrum”, they went right back to 2 percent through January 2015 when the tapering actually occurred.
This, by the way, is why we’re so leery of recommending a big Technology/Growth stock underweight even though we see more opportunities in cyclicals. If the idea that Treasuries need a lot more evidence about inflation before their yields noticeably rise proves correct, we could be in a 1.25 – 1.75 percent yield band for the next few years. That would support high-multiple stock valuations and Tech sector fundamentals in particular are excellent.
Takeaway: predicting inflation and calling bond yields are 2 different things. History shows Treasuries wave away short-term inflation and rely on longer-run trends. The last decade saw very low measured inflation, and that – not current day inflation – is what this market cares about most.
Tyler Durden
Mon, 06/14/2021 – 06:30![]()
Zero Hedge’s mission is to widen the scope of financial, economic and political information available to the professional investing public, to skeptically examine and, where necessary, attack the flaccid institution that financial journalism has become, to liberate oppressed knowledge, to provide analysis uninhibited by political constraint and to facilitate information’s unending quest for freedom. Visit https://www.zerohedge.com