Op-Ex Panic-Bid Rescues Global Stocks From Worst Week In 6 Months As Fed Taper Looms
Not a good week in the real world – Bad retail sales data, slumping consumer and business confidence, COVID cases surging (but not deaths), Delta fearmongering max’d out, oh, and US lost a war… Global economic data is disappointing at its fastest pace since the COVID lockdowns began…

Source: Bloomberg
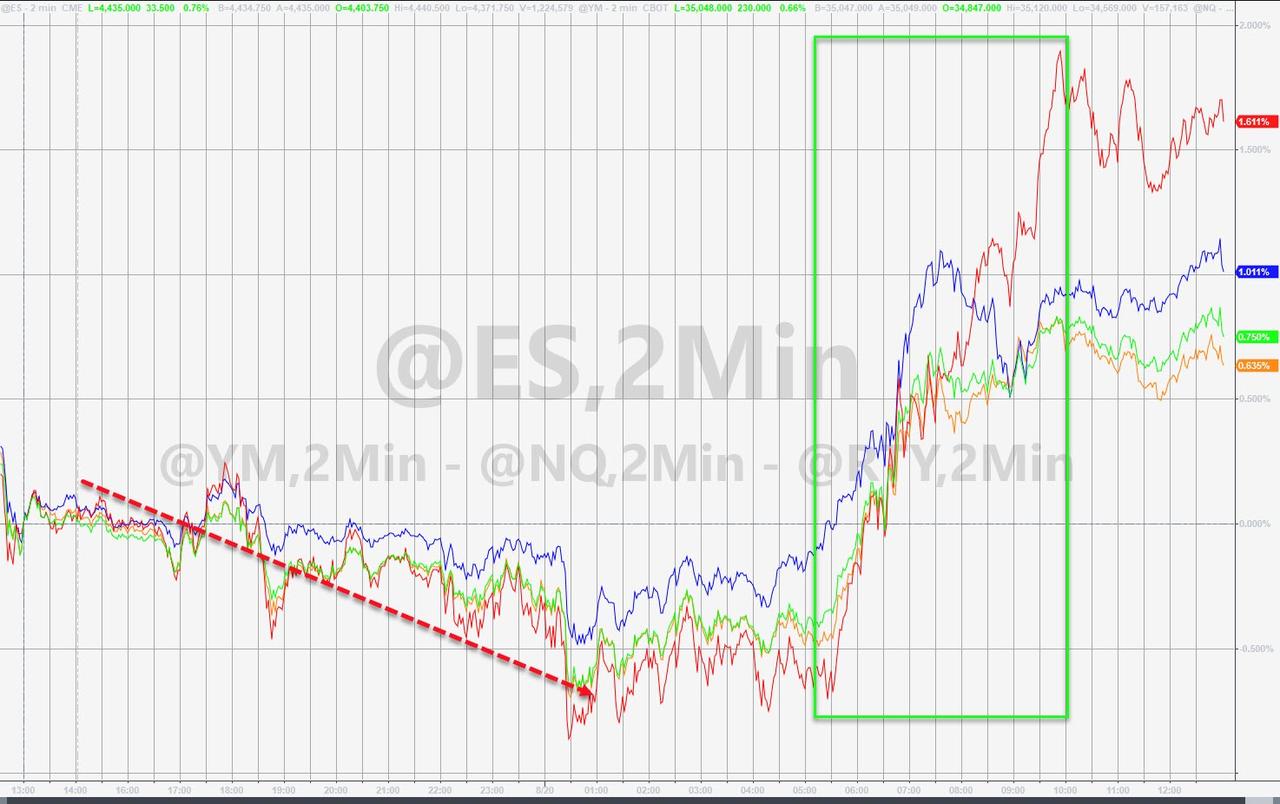
S&P 500, Dow were on track for their worst week in 2 months on recovery and taper fears until today’s idiotic meltup (which had the stench of gamma squeeze written all over it). Small Caps literally exploded higher from down around 1% in the pre-market to up almost 2%…
Sigh…

Time for some reflection…
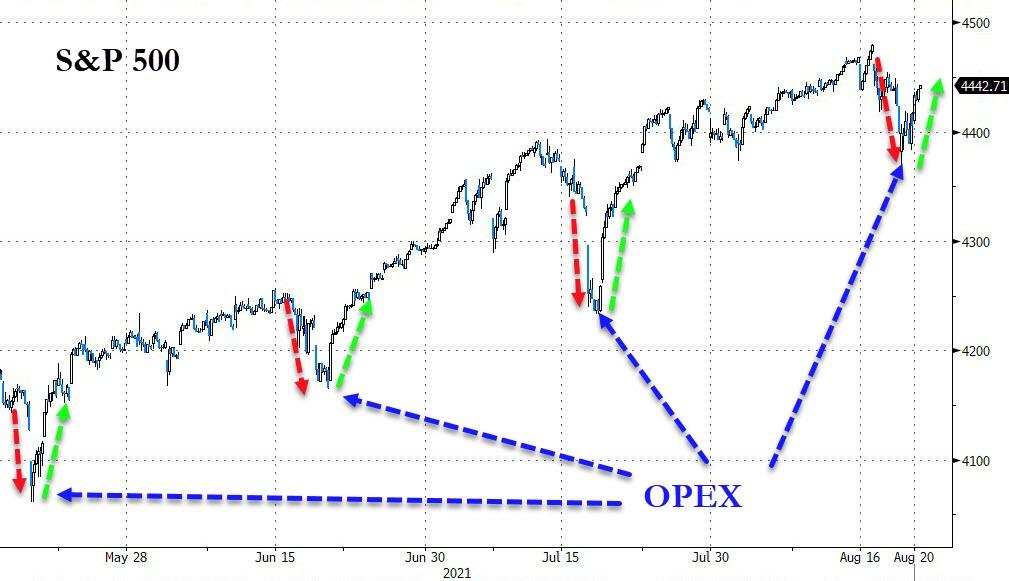
And in case you were wondering why “investors” decided today was the day to panic-bid stocks no matter what… they didn’t – it was options expiration bullshit once again as 20% of Gamma evaporates at the close and market-makers are squeezed into that drop…
Source: Bloomberg
But on the week, all the US majors were down with Small Caps worst (even though the algos did their very best to back Nasdaq back to even)…

Today’s manic-ramp lifted the S&P back to FOMC Minutes levels, but it could not get past that…

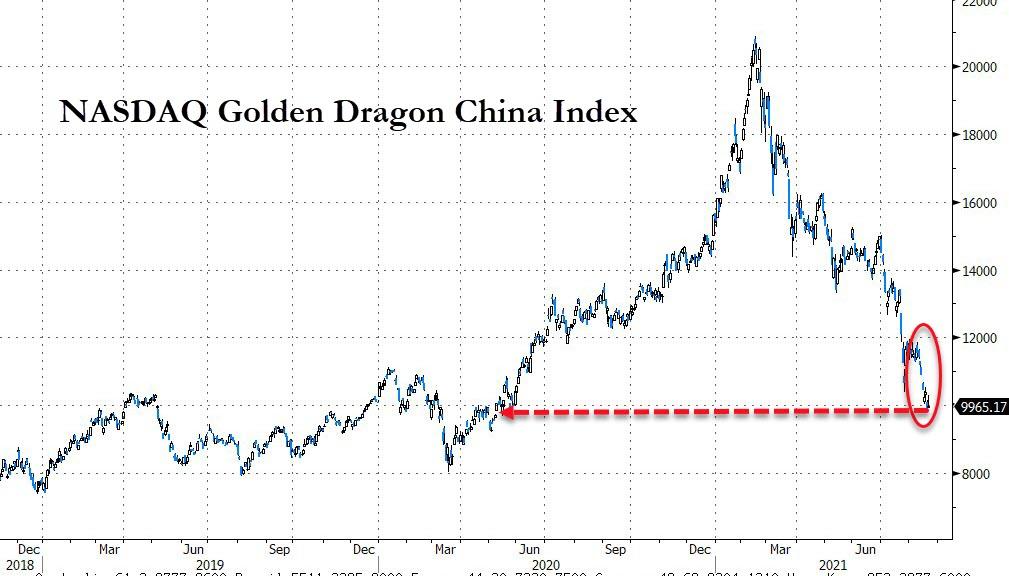
The Golden Dragon China ETF suffered its eighth straight weekly loss – its longest losing streak in a decade…
Source: Bloomberg
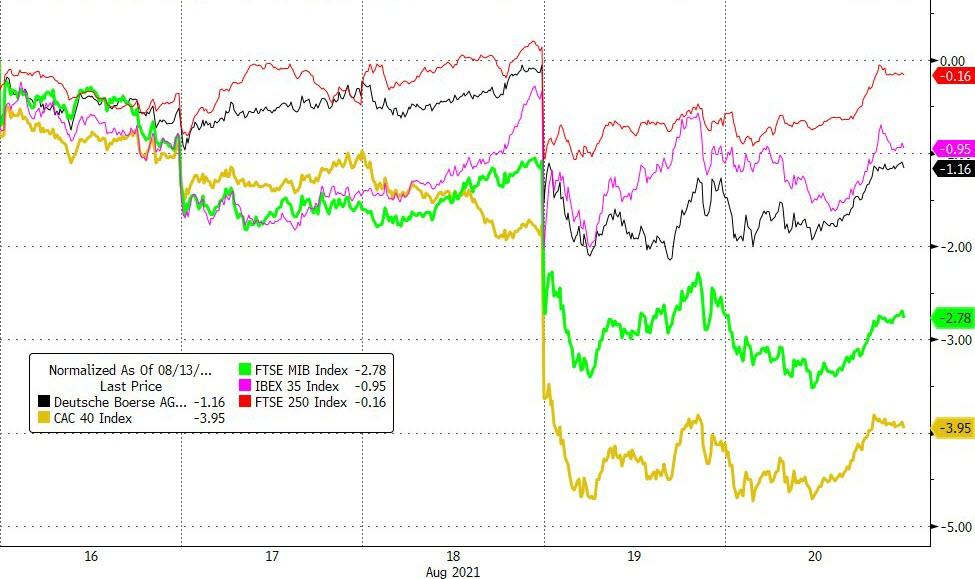
European stocks suffered their biggest weekly loss since February (with France and Italy hit worst)…
Source: Bloomberg
And The MSCI World Index was down significantly ahead of today’s US trading, on course for its biggest weekly fall since February, but the op-ex based panic-bid today rescued them…

Source: Bloomberg
Energy stocks were clubbed like a baby seal this week while Utes an Healthcare ended the week with gains…
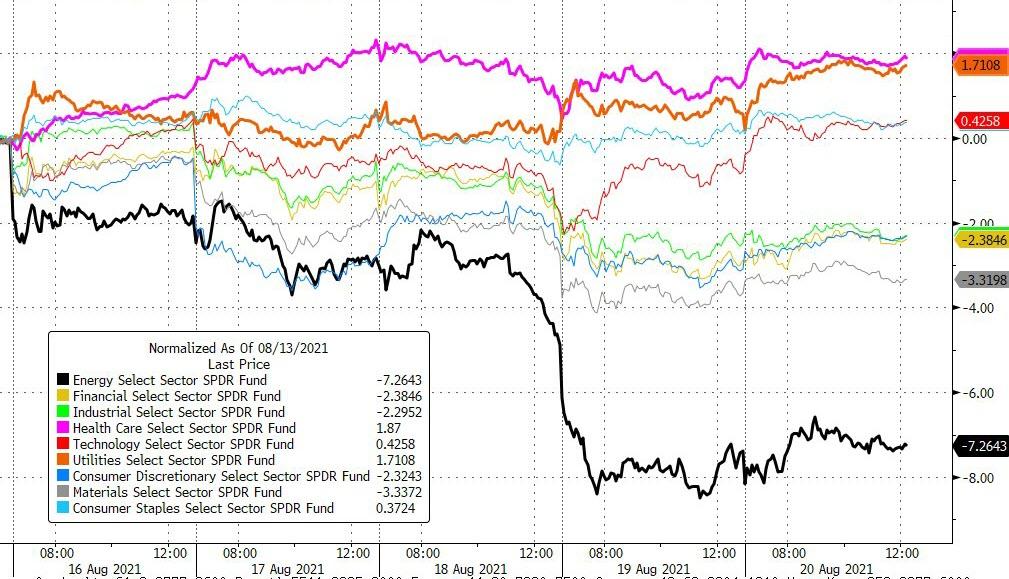
Source: Bloomberg
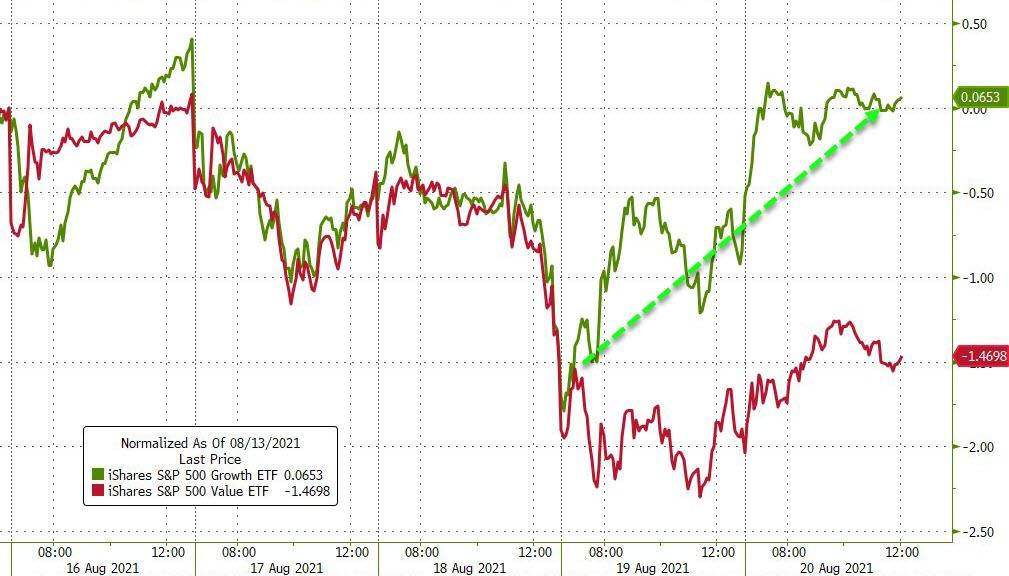
Which is confirmed by the fact that cyclical stocks suffered most and the rush into defensives dominated gains…

Source: Bloomberg
Growth stocks soared in the last two days after The FOMC’s statement sparked some weakness
Source: Bloomberg
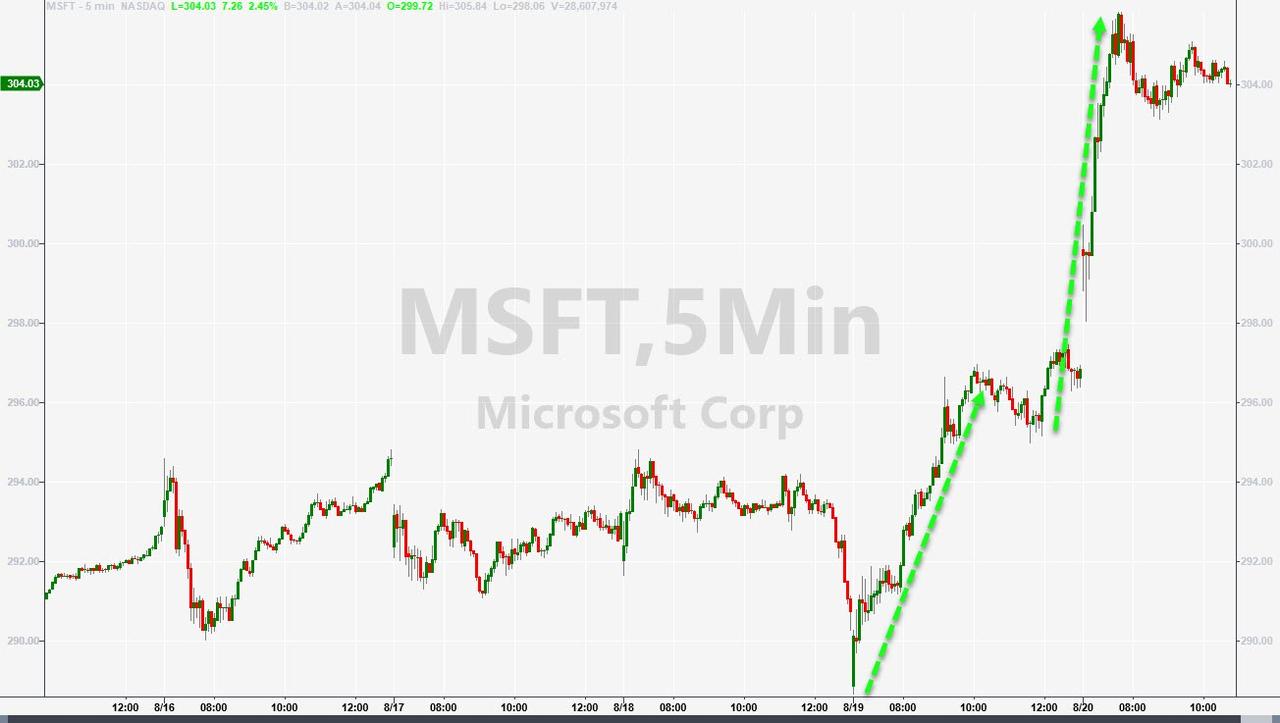
Tech outperformed, helped in large part by a somewhat insane 6% vertical ramp in MSFT in the last two days…
Treasuries were mixed this week with the long-end bid (30Y -6bps) and short-end higher in yield (2Y +2bps)…

Source: Bloomberg
The 30Y yield was a ‘death cross’ – meaning yields are expected to drop further – this week..

Source: Bloomberg
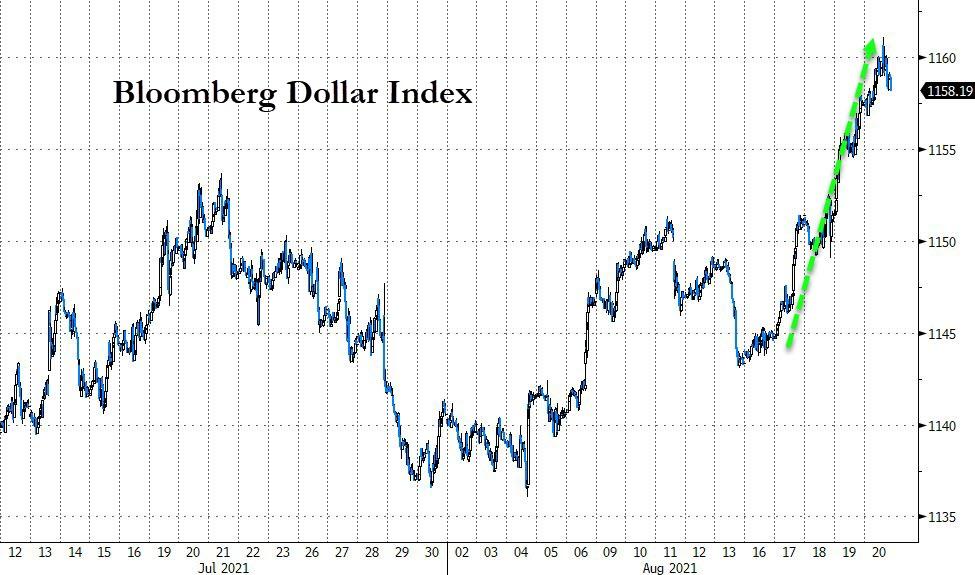
The dollar soared this week (rising every day of the week). This was the second biggest weekly gain for the dollar since Sept 2020…
Source: Bloomberg
Cryptos were mixed on the week after early weakness was turned around with a serious bid for the major coins in the last two days (helped by COIN’s news)…
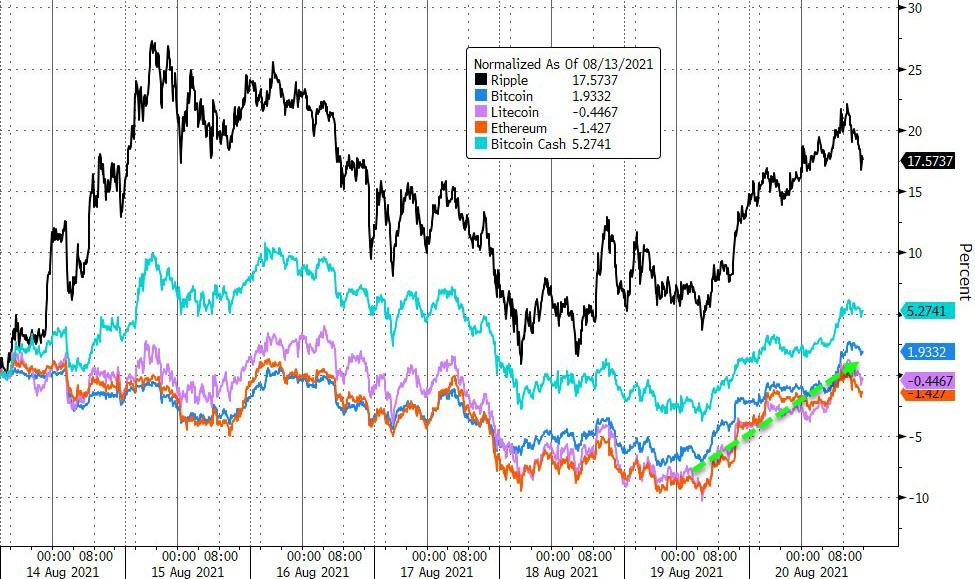
Source: Bloomberg
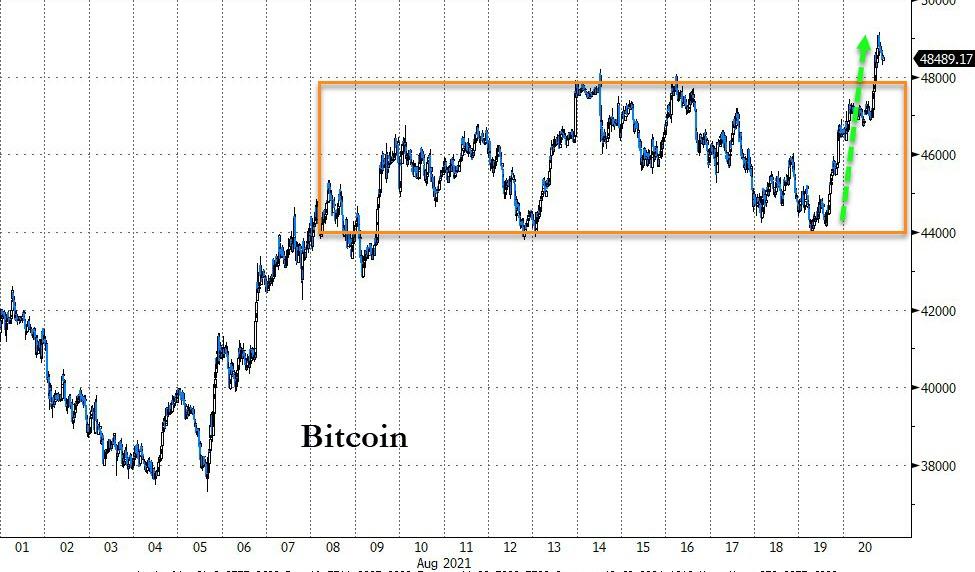
Bitcoin broke out above its recent range after Coinbase announced it was buying more…
Source: Bloomberg
Ethereum is back at the upper end of its recent range

Source: Bloomberg
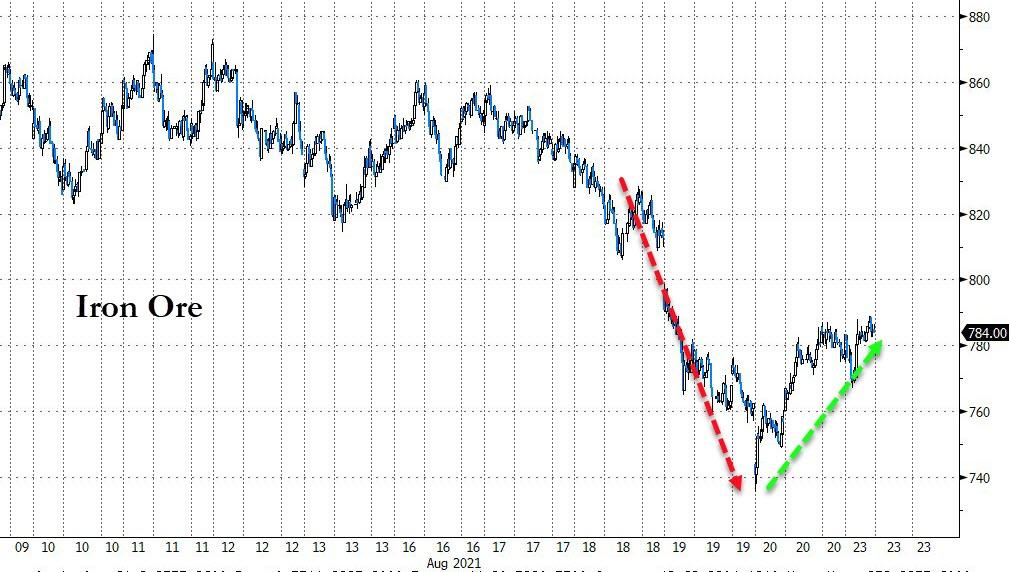
Big rebound to end the week in Iron Ore which was on its way to the worst week since 2019…
Source: Bloomberg
Oil’s down for 7 straight days – the longest losing streak since the April 2020 COVID lockdown collapse – with WTI plunging to a $61 handle by the close (and second worst week of the year)…
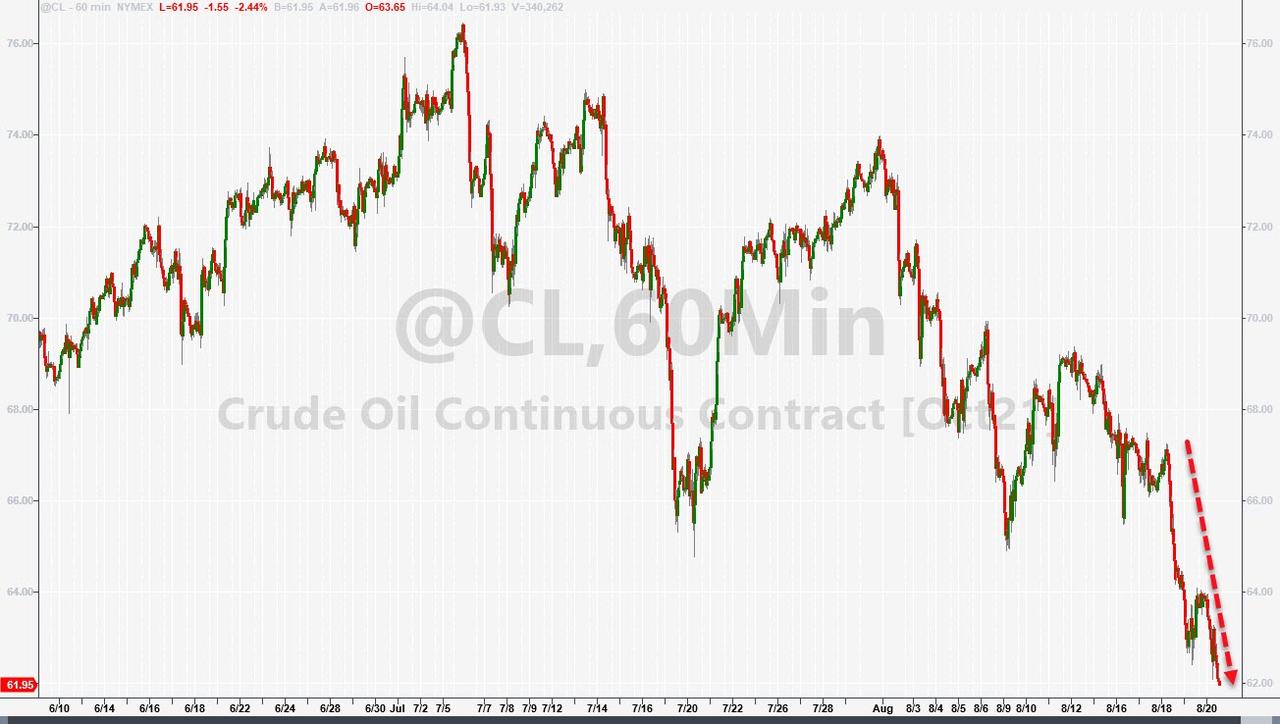
As Rabobank notes, oil markets were hit by waves of selling pressure this week as short-term systematic funds pivoted from liquidating “long” oil futures positions to building outright “short” positions. This mechanical selling was evident at times, and our own proprietary CTA model further confirmed this notion, as several key signals flipped from “long” to “short” in the oil complex mid-week. More specifically, it was the short-term momentum and some trend signals that turned bearish this week. Furthermore, medium-term momentum signals are also at risk of flipping from “long” to “short” over the coming days should prices continue to weaken, which could bring another wave of aggressive systematic selling to the oil market before the pressure subsides.
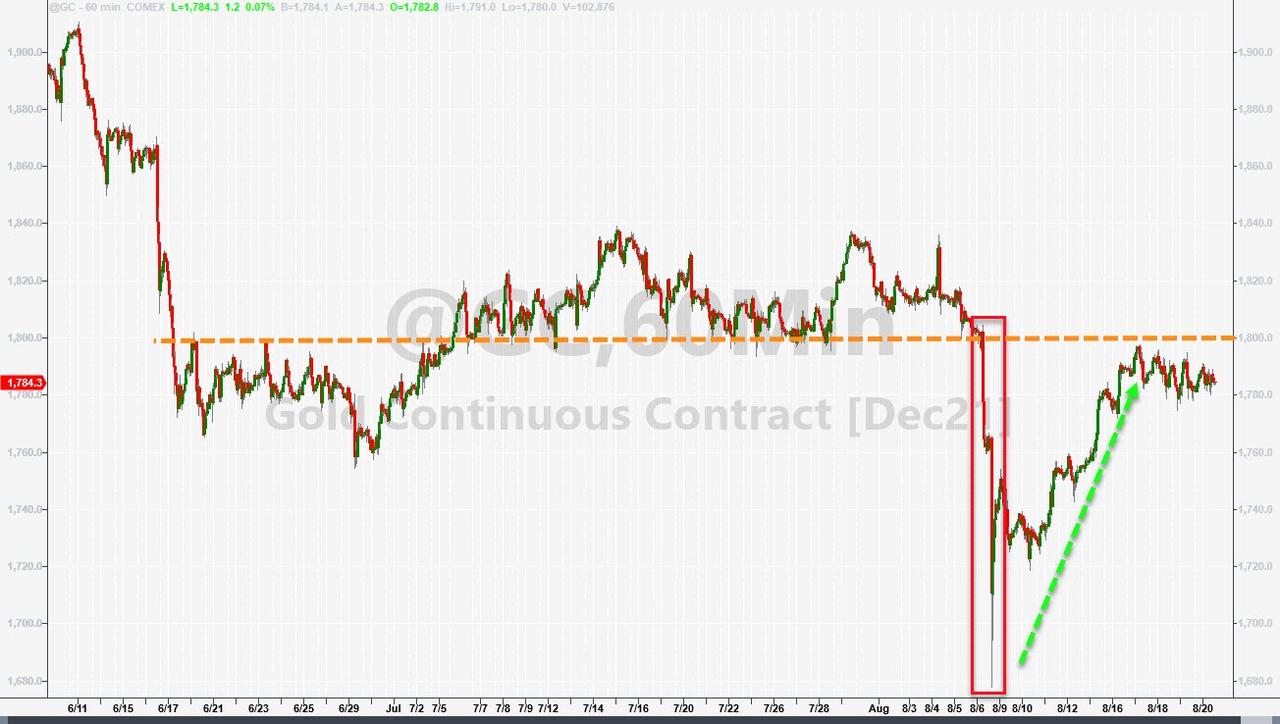
Gold held on to gains this week after last week’s flash-crash but was unable to break back above $1800
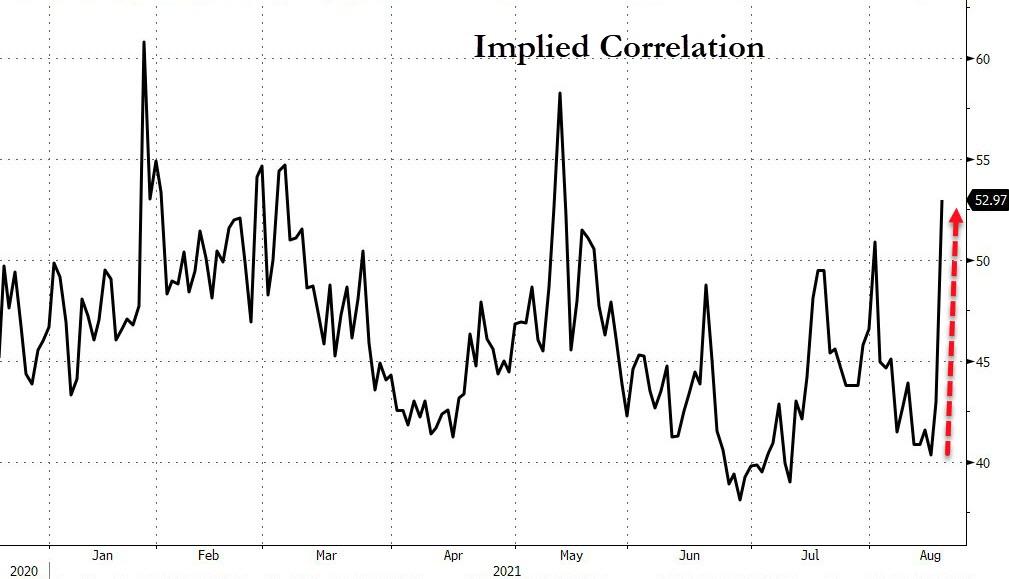
Finally, while markets melted up today, we do note that the real fear index is flashing a little red. Implied correlation spiked this week as traders reached for macro-overlays over single-stock hedges…
Source: Bloomberg
By implicitly measuring the market’s demand for this relative protection – and its implicit downside risk sentiment – implied correlation is much more applicable as a measure of investor sentiment.
As a reminder, implied correlation, a topic we have discussed in the past at length, quantifies the difference between the index’s volatility and the summation of the underlying volatility of the names in an index. In a nutshell, the implied correlation measures the relative demand for instant liquid index macro protection relative to its underlying names (a slower less liquid way to protect yourself). The higher the correlation, the greater the risk of a very significant downside move (since correlations tend to approach 1 when systemically bad events occur).
VIX remains useful in a self-fulfilling way since so many market participants watch it but with ETFs impacting the short-dated vol markets more and more, we suspect implied correlation (with its ‘relative’ measure of risk) may well become more focused upon.
While the S&P 500 may only be 2% or so from its record highs, the average stock is down 15.8% from its 52-week highs…
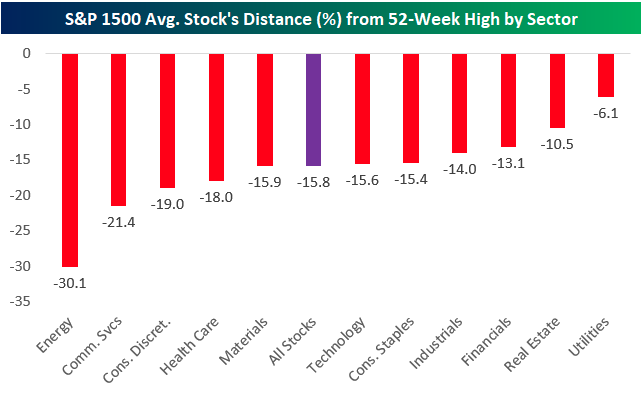
h/t @bespokeinvest
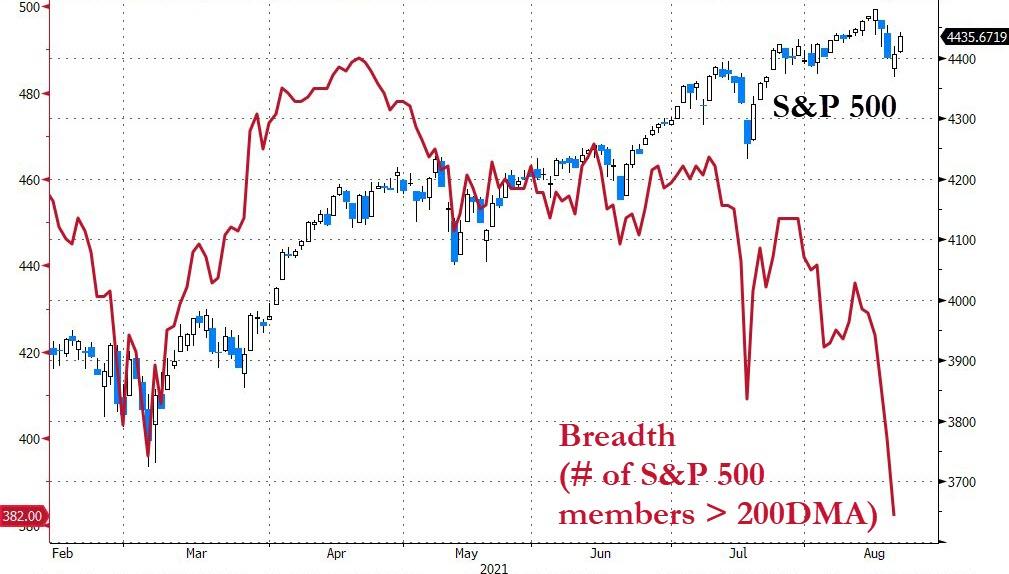
And while we are on that topic, breadth is abysmal in the broad stock market…
Source: Bloomberg
Tyler Durden
Fri, 08/20/2021 – 16:02![]()
Zero Hedge’s mission is to widen the scope of financial, economic and political information available to the professional investing public, to skeptically examine and, where necessary, attack the flaccid institution that financial journalism has become, to liberate oppressed knowledge, to provide analysis uninhibited by political constraint and to facilitate information’s unending quest for freedom. Visit https://www.zerohedge.com