For The First Time Since The Crisis, Companies Spent More On Buybacks And Dividends Than They Earned…
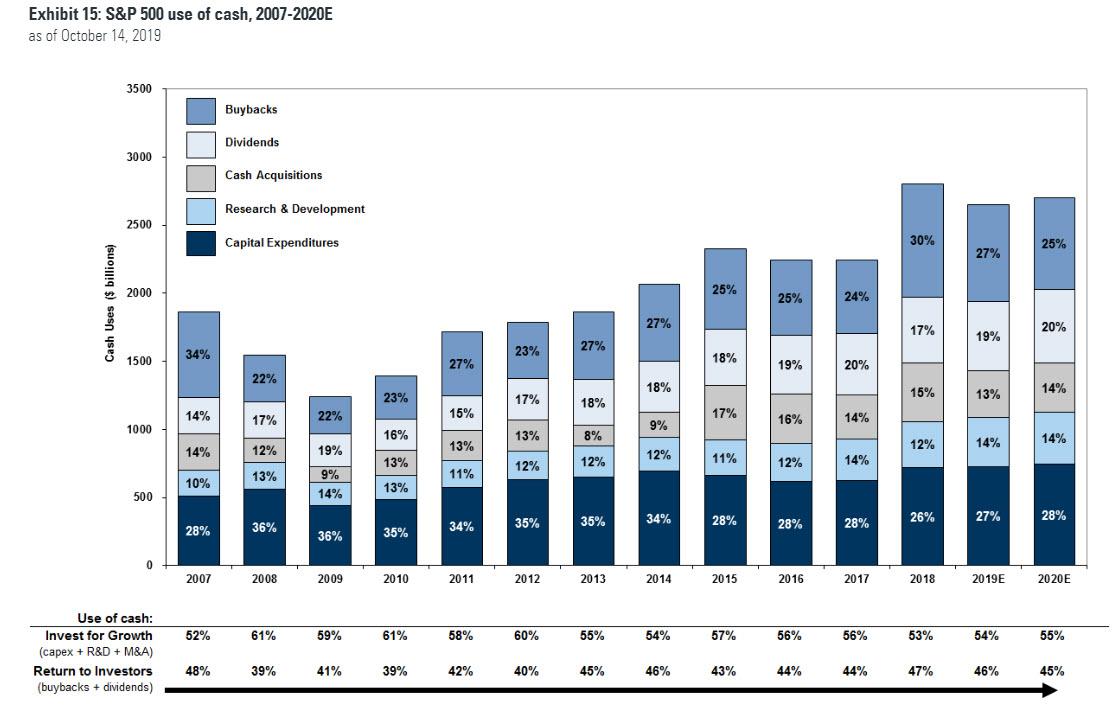
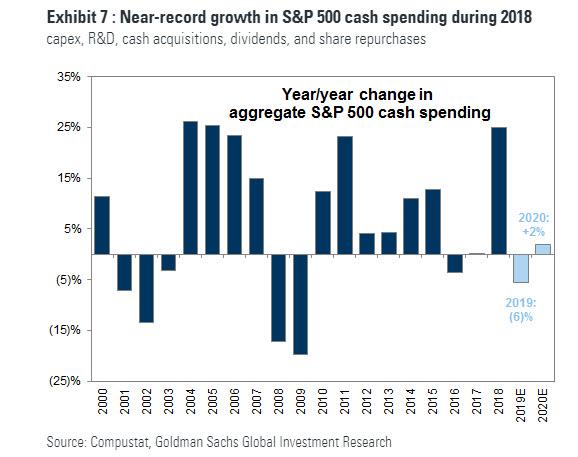
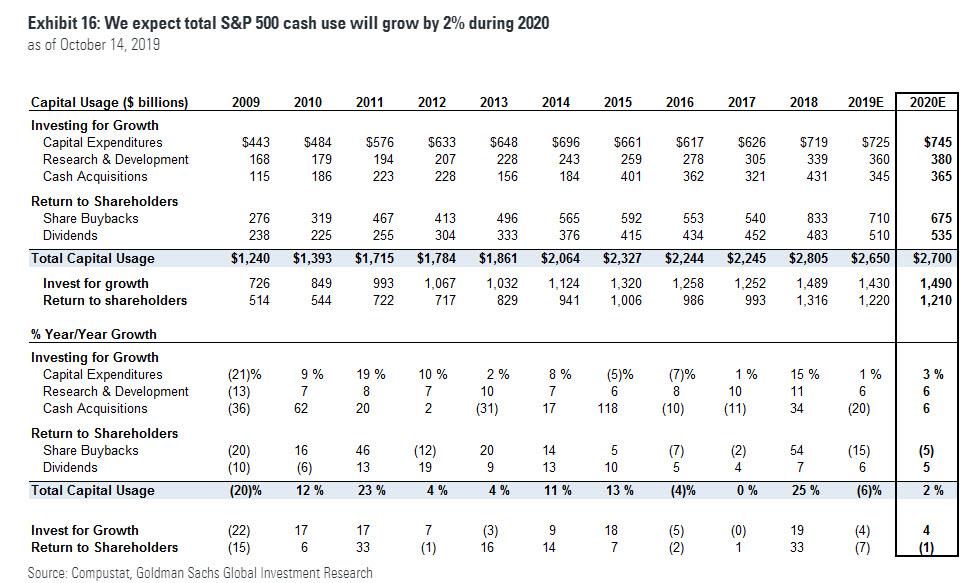
It will hardly come as a surprise to many, but according to the latest cash flow analysis from Goldman Sachs, 2018 was a record year for S&P 500 cash spending: not only did aggregate spending on capex, R&D, cash acquisitions, dividends, and share repurchases rose by 25% to $2.8 trillion, “the fastest year/year growth in 30 years”…
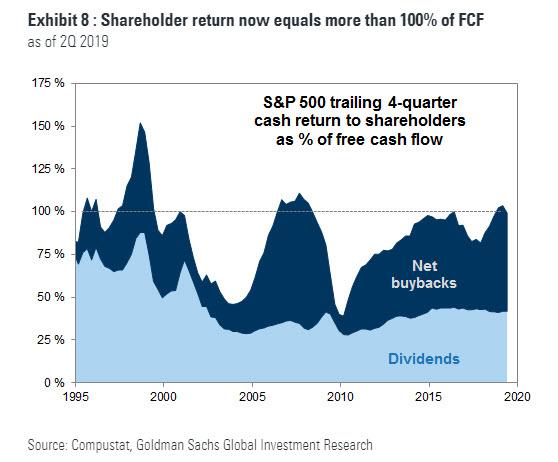
… but more notably, for the first time since the financial crisis, companies spent more on dividends and buybacks than they generated in free cash flow to wit: “share repurchases surged by 54% to $833 billion and for the first time in the post-crisis period net buybacks and dividends during 2018 totaled more than 100% of free cash flow.”
One thing to note: the last time companies returned so much cash to shareholders, the market crashed right after.
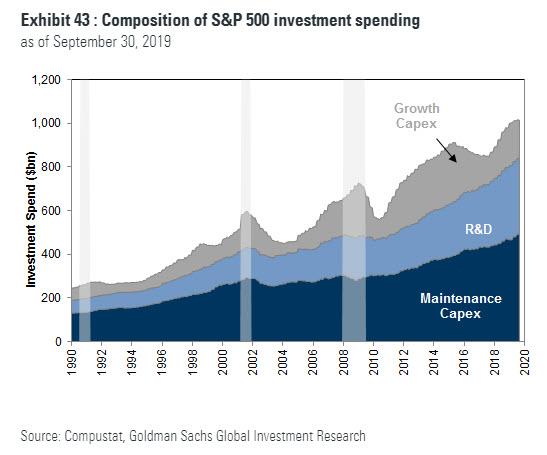
Of course, history never repeats, so instead let’s focus on the glimmer of good news uncovered by Goldman, namely that all those who predicted that most of the cash repatriated by US companies would be used entirely on buybacks were only partially right, because as Goldman also found, “investment growth was also strong” as capex and R&D also grew by 14% to a combined $1.1 trillion and totaled 9.7% of sales during 2018, the highest share since at least 1990.
Alas that’s as good as it gets, because as the bank predicts looking at the end of 2019 and into 2020 and onward, the growth in cash spending is expected to hit a brick wall. According to Goldman’s Cole Hunter, “we estimate cash spending will fall by 6% during 2019 before rising by a modest 2% during 2020.”
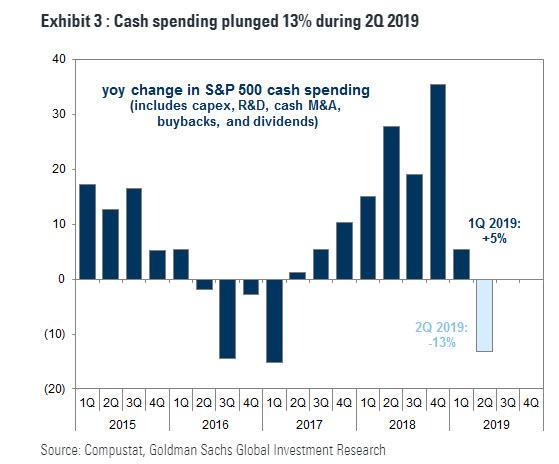
Specifically, S&P 500 cash spending rose by 5% during 1Q, but plunged by 13% yoy during 2Q.
And here comes the bad news for Wall Street’s investment bankers – as well as for shareholders who have directly benefited from the recent record surge in buybacks which sent the S&P to all time highs. According to Goldman, in 2019, the decline in spending will be driven by a 20% drop in cash M&A and a 15% fall in buybacks. It gets worse in 2020, when Goldman expects that the modest growth in capex (+3%), R&D (+6%), dividends (+5%), and cash M&A (+6%) will be partially offset by a 5% decline in share repurchases.
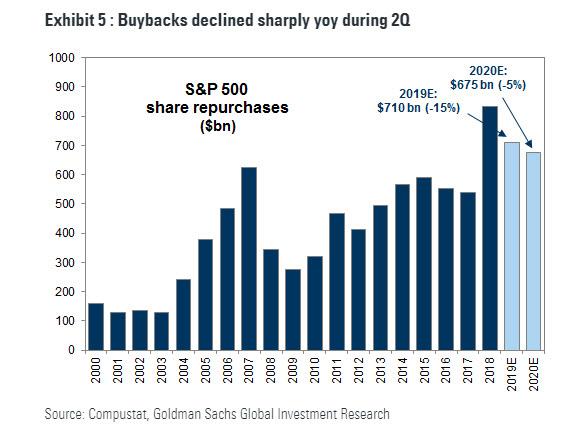
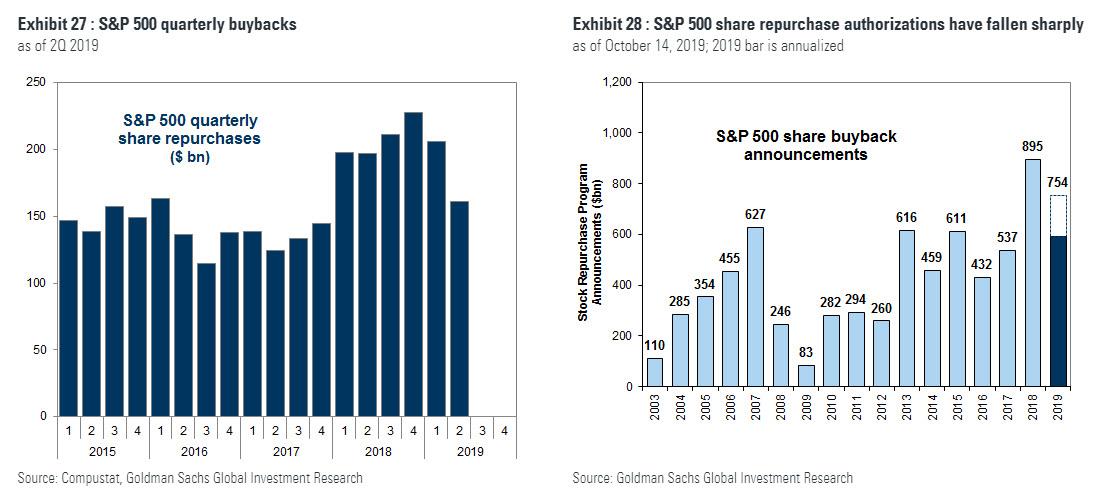
And here is the chart showing why for corporate America, 2018 may have been as good as it gets.
The chart above shows that share repurchases fell by 18% year/year during 2Q and have declined by 7% YTD. Health Care contributed more than 50% of the aggregate decline in buyback spending during 1H 2019 vs. 1H 2018. “Reduced cash balances, increased leverage, elevated payout ratios, and high policy uncertainty will lead to a further 5% decline in S&P 500 buybacks during 2020”, Goldman predicts.
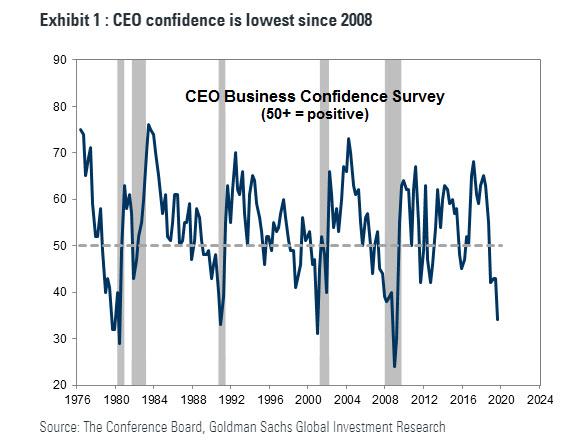
What does Goldman attribute the coming crunch in corporate cash spending by corporate America, and outright decline in buybacks, on? In a word: collapsing CEO confidence, which has plunged to the lowest level since the Global Financial Crisis amid outright expectations for a recession.
As shown above, in 3Q, the Conference Board’s survey of CEO confidence plummeted to the lowest level since the Global Financial Crisis. Separately, according to the Duke University CFO Global Business Outlook, 53% of US CFO respondents believe the US will be in recession by the 3rd quarter of 2020 and 67% believe the US will enter recession by the end of 2020.
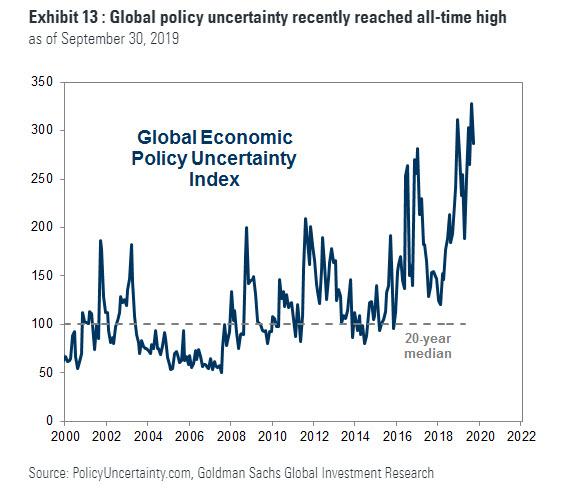
This is taking place as global economic policy uncertainty hit the highest reading in at least 20 years.
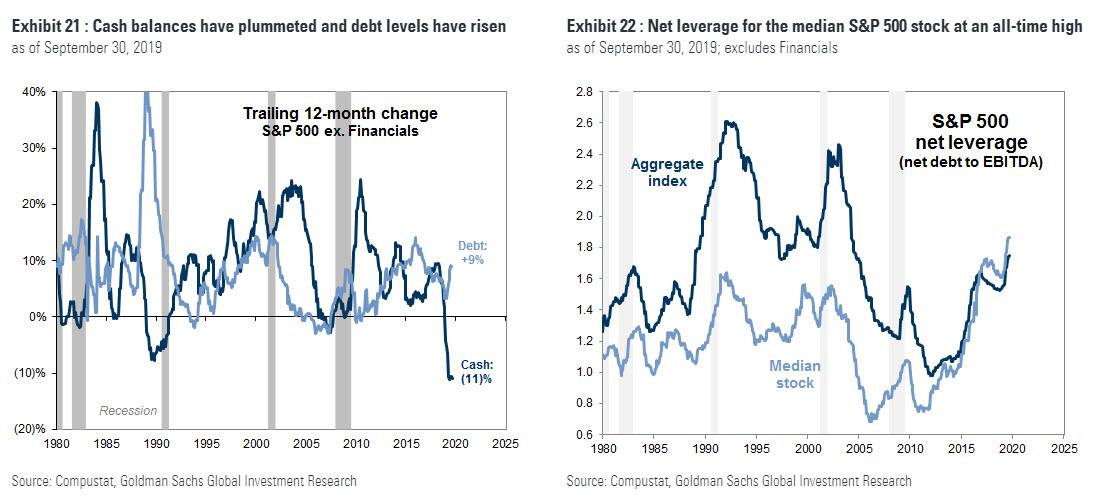
Meanwhile, as we reported back in July, corporate cash balances recently plunged by the most on record while leverage recently registered a new all-time high.
As shown above, non-financial S&P 500 cash balances have declined by 15% during the past 12 months, the largest fall since at least 1980. At the same time, aggregate net leverage (net debt / EBITDA) has climbed to the highest level since March 2005 and leverage for the median S&P 500 stock stands at an all-time high. The silver lining: low interest rates have dampened the effect of rising leverage on interest coverage ratios… for now.
Putting it all together, Goldman notes that “heightened uncertainty, low CEO confidence, and tepid earnings growth have contributed to a collapse in buybacks and cash acquisition spending and a slowdown in capex growth YTD.”
As a result, for 2019, the bank now expects total S&P 500 cash spending will decline by 6% led by a 20% fall in cash M&A and a 15% drop in buybacks.
Finally, looking into the critical for markets, and domestic politics, 2020 Goldman now expects total cash spending will grow by a modest 2% to $2.7 trillion.
Firms will invest 55% of this sum for growth (capex, R&D, and cash M&A) and return 45% to shareholders (buybacks and dividends). We estimate cash return to shareholders will fall by 1% to $1.2 trillion as a 5% decline in share repurchases more than offsets 5% growth in aggregate dividends. Investment for growth will rise by 4% to $1.5 trillion, with the key cash changes as follows:
- Buybacks ($675 billion, -5%): Aggregate buyback spending will slide by 5% during 2020 as companies pull back on cash return in an environment of heightened uncertainty. Cash balances have declined sharply, net leverage has inflected higher, and earnings growth is likely to remain weak. The trade conflict with China remains fluid no deal is expected before the 2020 presidential election. Finally, the conversation around the economics of share repurchases is likely to intensify during 2020 ahead of the US presidential election.
- Capex ($745 billion, +3% growth): S&P 500 capex will grow by 3% during 2020, but most of the growth will be for “maintenance capex” rather than “growth capex.” Ex-Energy capex will grow by 3% during 2020, supported by the highest non-Financial corporate profitability (ROE) in more than 40 years, steady continued sales growth, and easy lending conditions. However, a narrow output gap and elevated policy uncertainty suggest firms are likely to be more judicious about spending next year. Energy capex will also grow by a modest 3% in 2020. Our commodity strategists forecast modestly lower oil prices, high price volatility, and the forward curve staying in backwardation through 2020.
- R&D ($380 billion, +6%): R&D spending will grow by 6% in 2020. Spending on R&D is highly correlated with capex spending, but is less volatile. R&D has only declined on a year/year basis during three years since 1990 (2002, 2003, and 2009). This experience suggests R&D spending is likely to continue to grow if the US economy avoids recession, as our economists expect.
- Cash M&A ($365 billion, +6%): S&P 500 cash M&A spending will increase by 6% to $365 billion in 2020, supported by a 6% climb in operating EPS, ample cash balances, and credit markets that remain accessible to finance transactions. Low CEO confidence has historically been associated with greater appetite for acquisitions vs. investment for organic growth.
- Dividends ($535 billion, +5%): S&P 500 dividends will grow by 5% to $535 billion in 2020, broadly in line with the 6% growth we expect in adjusted earnings. The payout ratio will remain mostly unchanged at 35% during 2020, in line with the 20-year average.
Needless to say, of the above, the most important prediction is Goldman’s forecast for a “collapse” in buybacks.
This is important because as even central banks and the IMF admit, the primary culprit behind the invincible strength of the stock market has been the tremendous growth in stock buybacks by corporations over the past two years, which had a habit of lobbing a barrage of repurchase orders just as stocks were about to crack. All of that is now ending.
Tyler Durden
Fri, 10/18/2019 – 12:15
![]()
Zero Hedge’s mission is to widen the scope of financial, economic and political information available to the professional investing public, to skeptically examine and, where necessary, attack the flaccid institution that financial journalism has become, to liberate oppressed knowledge, to provide analysis uninhibited by political constraint and to facilitate information’s unending quest for freedom. Visit https://www.zerohedge.com
