Trader Warns: This Rally Is “Fraught With Problems”
Authored by Sven Henrich via NorthmanTrader.com,
As the 3 main indices have made multiple new highs in recent days and weeks it may be worth to keep taps on the health of this rally. Why? Because for rallies to be sustainable you want to see rallies show supporting signals. This rally doesn’t. It’s fraught with problems and I’ll highlight a few of these.
In fact the divergences that signal problems with the rally are profound, but they won’t mean anything until they do. But once they do they will have signaled that this rally was not sustainable.
High yield, a key supporting driver of rallies past has negatively diverged:
As I outlined on twitter a few times consumer discretionary has not been participating at all and has failed to make new highs, but rather a series of lower highs:
$NYMO: All new highs have come on negative readings suggesting a profound weakening of the rally similar to what we’ve seen during previous rallies that have led to corrections:
$NAHL: Recent $NDX highs have come on virtually no expansion in new highs/new lows:
The rally has been highly dependent on a high number of open gaps leaving markets at risk of a filling of many of these gaps in the days/weeks to come:
All of this comes in context of a market trading at 147% market cap to GDP with record short positioning in $VIX:
..and price to sales at 2000 type levels:
With key stocks such as $AAPL vastly overbought and technically stretched:
$AAPL:
Is all this price action a sign of an economy improving or growing vastly?
Transports say no, still no break out above the 2 year range:
The value line geometric index still hasn’t confirmed new highs either:
Indeed looking at the structure of the market this rally so far does not look any different than the ones we’ve seen before:
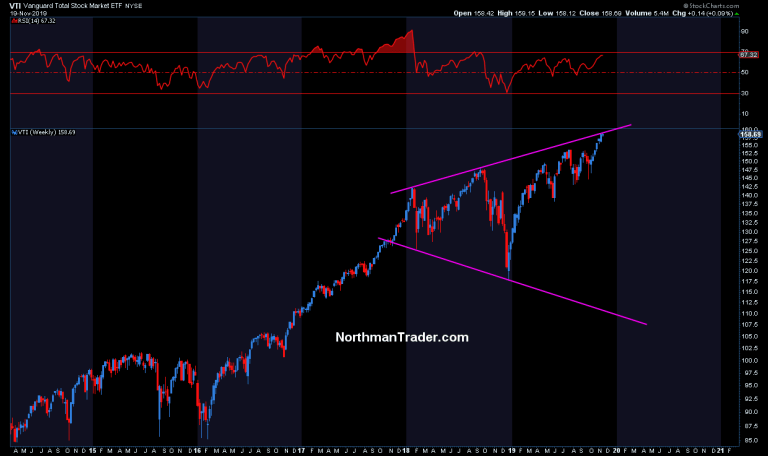
In fact the overall market has hit key trend line resistance:
With new highs now not reaching higher than the previous new highs. Recall incremental new highs have been limited to 3%-3.5%:
(see context of this chart discussed in this weekend’s video).
Now it may well be said that none of this matters if this rally is primarily inspired by the Fed’s liquidity injections. After all we can see that markets have rallied harder on days of larger repo operation and rallied less on days with smaller repos:
Perhaps it’s all coincidental, but the chart appears to show quite a bit of correlation. Liquidity is liquidity and of course the Fed, like other central banks across the globe, is busy adding liquidity and markets appear to flow along with the amount of liquidity coming into the system:
Where would markets trade without all that liquidity thrown in? We may never know, but the signal charts suggest this rally is not as strong as it appears, in fact it is full of problems, weak underneath, very weak and that makes its sustainability highly questionable especially considering it appears driven by liquidity only, not based on any fundamental growth basis.
Record $VIX short positioning, record highs on price to sales, 147% market cap to GDP, key stocks vastly overbought and technically stretched.
What could possibly go wrong?
* * *
For the latest public analysis please visit NorthmanTrader. To subscribe to our market products please visit Services.
Tyler Durden
Wed, 11/20/2019 – 13:30
![]()
Zero Hedge’s mission is to widen the scope of financial, economic and political information available to the professional investing public, to skeptically examine and, where necessary, attack the flaccid institution that financial journalism has become, to liberate oppressed knowledge, to provide analysis uninhibited by political constraint and to facilitate information’s unending quest for freedom. Visit https://www.zerohedge.com


