Smackdown – Following The Bear Market Bounce Script
Authored by Sven Henrich via NorthmanTrader.com,
A violent rejection in markets following a furious rally that began on March 23. Small caps rallied 10% in 3 days only to give it all away in just 2 days.
A coincidence? Hardly. Firstly the risk levels of this rally were well advertised in advance including on March 28 in “Answers”. Technical patterns forming then were already suggesting that the price levels just reached were a distinct possibility. And a furious rally to come that would be awe-inspiring was also suggested in the 1929 redux posted on the day of the lows. No rallies are more aggressive than bear market rallies and seeing April producing one of the most aggressive rallies in decades surely fits that script.
Markets, it could be argued, just followed a historic script that was advertised well in advance despite historic interventions on the monetary and fiscal fronts.
And despite all these interventions markets showed a notable technical rejection at precisely at the same end zone as during prior bear market rallies, the monthly 15MA:
The implications could be profound for these previous bear market rallies set the stage for new market lows to come.
None of this is confirmed of course for the battle between liquidity, fundamentals and technicals will continue and the market path in May and June will likely tell us a lot more.
But note what happened this week coinciding with the technical tag and subsequent rejections.
Markets galloped to a massively overvalued 138% market cap to GDP valuation:
Congratulations @federalreserve.
Market cap to GDP is back up into bubble territory at a whopping 138%. pic.twitter.com/lIZODm5iCF— Sven Henrich (@NorthmanTrader) April 30, 2020
https://platform.twitter.com/widgets.js
Valuations entirely inconsistent with the economic reality and earnings picture and outlook on the ground.
One person to seemingly agree is Warran Buffett whose name has been associated in the past with the very market cap to GDP measure, hence coined the Buffett indicator.
This weekend Buffett indicated to shareholders that he’s not finding places of value to invest and has announced the selling of all airline shares with the view that the impacts of the recent crisis will not magically disappear but will take time to filter through the system:
Maybe he’s watching the Buffett indicator as stocks hit 138% market cap to GDP this past week… https://t.co/Y2UUCIdca4
— Sven Henrich (@NorthmanTrader) May 3, 2020
https://platform.twitter.com/widgets.js
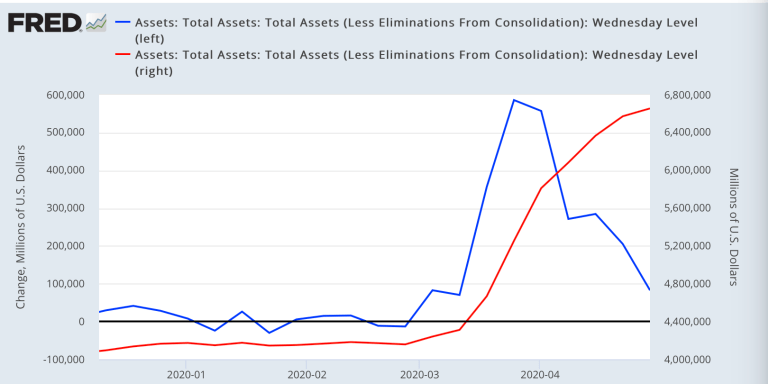
Of further note: Investors suddenly appeared to get cold feet on Thursday realizing that the Fed suddenly had drastically reduced the pace of its balance sheet expansion:
While the interventions are still historically gigantic a drastic reduction in incremental liquidity amounts to a relative tightening. Markets that have been entirely dependent on artificial liquidity have yet to prove they can do without. In fact all evidence points to the contrary, for the liquidity reduction in 2018 resulted in a massive market correction and the 2019 rally didn’t really take off until the Fed expanded its balance sheet by nearly half a trillion dollars into Q4 and Q1.
No, last week’s month end rally disappeared as quickly as it appeared leaving a massive weekly rejection candle:
A rejection that occurred ironically from the very same price and date as the the rejection in 2019 when unemployment was 3.5%. Now we have 30M newly unemployed and Q2 GDP looking to drop between 20%-30% following a 4.8% drop inQ1 GDP.
We live in a world where some believe the Fed can just magically create GDP out of thin air:
When considering recent GDP losses, don’t underestimate the @federalreserve & other central banks’ ability to put money & liquidity into the market. The liquidity & stimulus provided by the Fed is capable of making up for a lot of lost GDP. https://t.co/l3ywteUufD
— Gary Cohn (@Gary_D_Cohn) April 29, 2020
https://platform.twitter.com/widgets.js
Just make it up. We will soon find whether his proposition will hold true. May and June may well turn out to be pivotal months for markets. The historic script suggests some more market volatility ahead, the liquidity script, should it remain in control, will continue to elevate asset prices above their fundamental worth.
For the latest technical review including risk and support levels please see the market video below:
[youtube https://www.youtube.com/watch?v=ahgc2aYgV0M]
Please be sure to watch it in HD for clarity.
* * *
For the latest public analysis please visit NorthmanTrader. To subscribe to our market products please visit Services.
Tyler Durden
Sun, 05/03/2020 – 11:30![]()
Zero Hedge’s mission is to widen the scope of financial, economic and political information available to the professional investing public, to skeptically examine and, where necessary, attack the flaccid institution that financial journalism has become, to liberate oppressed knowledge, to provide analysis uninhibited by political constraint and to facilitate information’s unending quest for freedom. Visit https://www.zerohedge.com


