JPMorgan Spots A Big Problem For Stocks
Tyler Durden
Wed, 07/01/2020 – 16:45
In the latest FOMC Minutes released earlier today, the Fed made it clear that contrary to near-consensus expectations that Powell would usher in some form of Yield Curve Control around the September meeting (if not sooner), such a move is unlikely to take place in the near future as Fed officials had “many questions” about the benefits of yield-curve control when they discussed its pros and cons at the latest Fed meeting, even as the Fed reiterated that it would keep rates at zero and continue to buy bonds “for many years.”
And while stocks barely reacted to the Fed’s surprising talk back of YCC, perhaps because algo subroutines weren’t sufficiently clear in what 23-year-old math PhDs expected from the Fed today, the fact that the Fed may be content with leaving things as is indefinitely, is a very worrisome development to none other than the most important bank in the world, JPMorgan.
As the bank’s quant Nick Panigirtzoglou writes in his latest Flows and Liquidity report, looking ahead at the second half, it is neither the second virus wave, nor the outcome of the president election that is keeping him at night, but rather a policy mistake that “worries us the most”, to wit:
One of the main topics of discussion with clients in recent weeks has been about the downside risks to the equity and risky market outlook into the second half of the year. Of the three main risks mentioned by clients, a second virus wave, a Democratic sweep in the US presidential election; and a policy mistake, it is the third one that worries us the most.
As Panigirtzoglou explains, “the risk of policy mistake is related to the idea that there is a need for additional stimulus going forward and if policy makers fail to deliver it, they would effectively slip behind the curve rather than staying ahead of the curve, risking a negative market response.”
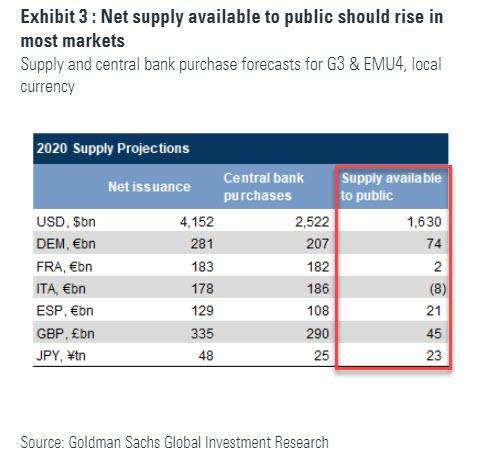
In other words, having injected over $3 trillion in liquidity in the past three months, JPM argues that this is nowhere near enough, and incidentally, the House of Morgan is not alone: after all this is precisely the same argument that Goldman made in mid-May when the bank “spotted a huge problem for the Fed“, namely that the Fed will need to monetize much more debt – about $1.6 trillion more – than it currently envisions in order to avoid a disorderly surge in Treasury yields.
In not so many words, JPMorgan agrees, and implicitly argues that soon the Fed will have to find a way to appease the market once again or risk a major market hit in the coming months.
Which brings us to the next question: “How should we monitor this risk of policy mistake?”
In his answer, Panigirtzoglou writes that “the lesson from the past and in particular from the Fed’s policy mistake of 2018, is that rate markets are likely to be more sensitive and more prompt in signalling any risk of policy mistake. The slope of the yield curve is an important metric to watch in this respect to gauge whether the risk of a policy mistake is re-emerging.”
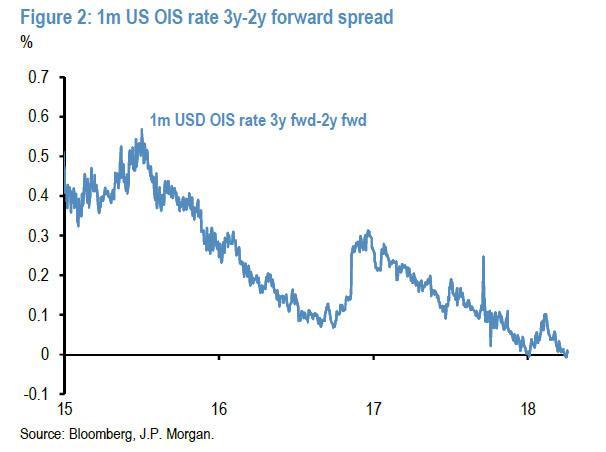
Here we take a slight detour to the first time the JPM quant made a similar warning, which was back in early April 2018 (as extensively discussed here), and around the time the Fed was overtightening and would continue to hike rates into December of that year, sparking the first bear market of the post-crisis era as markets turmoiled in response to the Fed, which had repeated the error of 1937 and nearly tightened right into a recession. While few warned this would happen at the time, Panigirtzoglou was one of them, highlighting that the curve between the 2-year and 3-year forward points of the 1-month OIS had inverted…
… with “such inversion generally perceived as a bad omen for risky markets.”
So if we fast forward to today, what is the yield curve signaling at the moment?
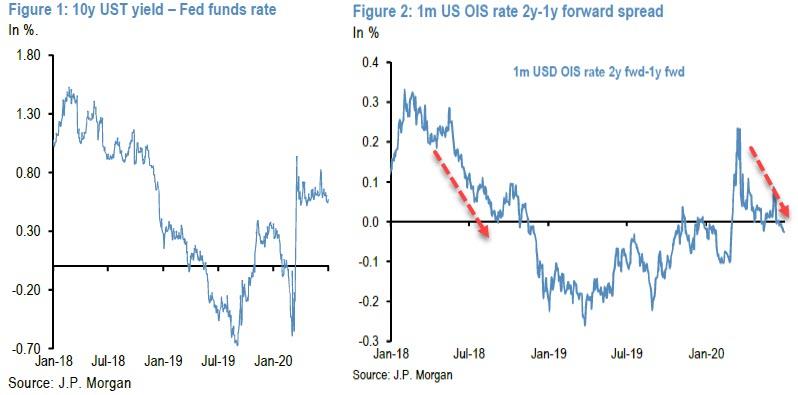
There’s some good and some bad news: while the 10y UST-Fed funds yield curve slope remains firmly into positive territory (Figure 1), this is not true with the slope at the front end of the US curve (Figure 2), which to the JPM quant “is a better signal of policy expectations” and is precisely the curve that JPM was focused on back in 2018 when the inversion accurately predicted the upcoming Fed policy error.
This, according to JPM, “is because the information content of the 10y UST-Fed funds yield curve slope might be blunted by investor flows and imbalances between bond supply and demand rather than expectations about policy”, which is a polite way of saying the yield curve is losing its signaling powers and is turning into pure noise as everyone scrambles to frontrun the Fed. Meanwhile, such frontrunning flows “should affect the front end of the curve by much less. For example, pension funds, insurance companies and banks, which together comprise the majority of foreign flows into USTs, tend to focus at either the long or the intermediate 2y-10y part of the UST curve.”
As a result, the right curve to keep an eye on is that of the very front end of the US curve as shown in Figure 2, and which as JPM lament “is unfortunately more negative than the message from Figure 1″, and here is the same punchline to what was observed back in 2018:
While the spread between the 1- and 2-year forward points of the US OIS curve in Figure 2 had improved rapidly and turned significantly positive after the dramatic policy response to the virus crisis last March, it has been slipping over the past couple of months and turned negative last week. It printed -3bp negative on Monday, June 29th.
For those who missed the prior two explanations (here and here) why this is significant and why this is important for risky markets, JPM had argued before – correctly – that the inversion at the front end of the yield curve had been one of the most important market indicators over the previous two years.
During 2018, JPM cautioned that the inversion at the front end of the US yield curve, since it first emerged in April 2018 between the 2- and 3- year forward points of the 1m OIS rate, had been an important market signal, suggesting markets were concerned over the risk of a policy mistake (Fed overtightening at the time) and thus downside risk for equity and risky markets.
JPM proved to be absolutely accurate as the events in Q4 2018 would demonstrate: indeed, this indicator had been worsening during 2018 not only by turning progressively more negative, but also by shifting forward to between the 1- and 2-year forward points since November 2018. And this negativity persisted during the course of 2019 up until last October, keeping the bank with a cautious stance until then, when none other than JPM conveniently sparked “NOT QE”, by inciting a crisis in the repo market and forcing the Fed to launch massive repo operations coupled with Bill monetizations, dramatically easing conditions.
The re-steepening seen after October 2019 was a positive development but it lasted only three months; that’s when a far more aggressive catalyst was needed. In January this year, the indicator of Figure 2 had turned significantly negative again, pointing to downside risk for risky markets at the time. Enter Coronavirus, the economic shutdown and the biggest liquidity injection of all time.
Questions about JPM’s – or the coronavirus’ – role in triggering massive QE episodes in the recent past aside, the lesson we learned from the past two years as well as from the previous cycles is that as long as the inversion at the front-end of the US yield curve persists, it may act to limit the upside to equity and risky markets and signals vulnerability to further negative shocks.
So, as Panigirtzoglouo warns, the re-emergence of that inversion last week is a warning sign. That said, the spread between the 1- and 2-year forward points of the US OIS curve in Figure 2 is not yet negative enough to be worried about a coming correction, but what it does is suggest that many market participants believe the combination of fiscal and monetary accommodation already in train is not yet sufficient given the size of the shock! If it was, the 1-to 2-year or 2- to 3-year forward spreads should be into positive territory.
You read that right: trillions and trillions in QE, corporate bond purchases, repos, FX swaps, debt backstops and so on, is no longer enough, which makes sense for a market that habituates to whatever the Fed’s latest liquidity injection is quickly… and then even quicker demand more.
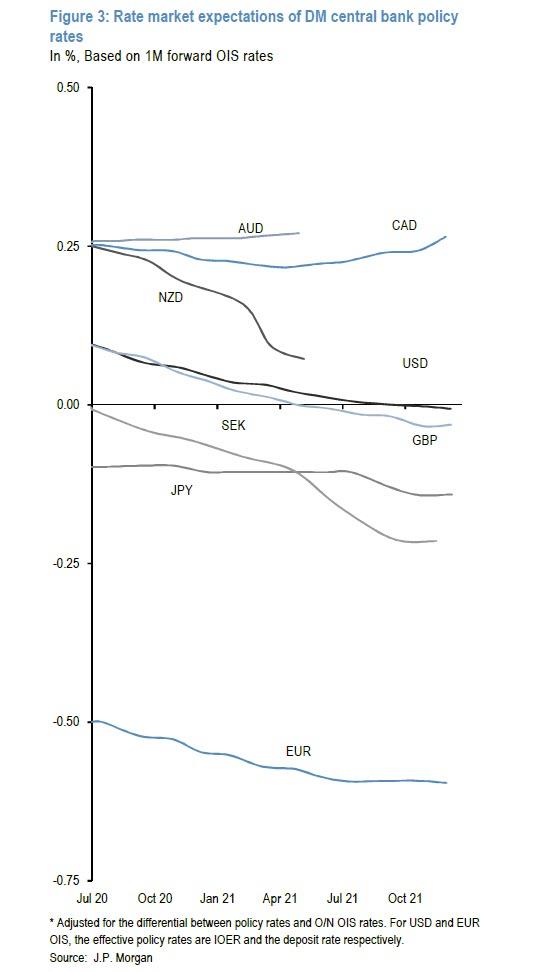
Meanwhile, JPM notes that markets signaling that further policy accommodation may be required is not only confined to the US. As shown by Figure 3 the inversion at the front end is prevalent across most DM yield curves. In some cases, e.g. with the BoE and RBNZ, the central banks have already signaled an openness to consider negative rates, while in others, e.g. with the Fed, markets price in a possibility of negative rates even where they have been more dismissive of the prospect.
To JPM, this suggests that rate markets are signaling the need for further monetary and/or fiscal policy stimulus across DM economies. And, logically, if the Fed turns a deaf ear to this latest extortion attempt by market, and additional stimulus is not delivered, then the inversion at the front end could worsen, “eventually becoming a more problematic signal for equity and risky markets going forward.“
In short: unless the Fed wants another market meltdown on its hands, it better pre-emptively stimulate and do so to the tune of trillions.
That said, the Fed still has time: JPM’s best guess is that this downside risk signaled by the re-emergence of money market curve inversion would not manifest itself into a substantial correction, as policy makers are likely to eventually respond to signs of deterioration, unless of course they do nothing like in 2018, and perhaps in 2020, with YCC now apparently on the back burner. Still, JPM is confident that “further monetary support, particularly in the form of QE, would likely provide support for risky assets either directly, in the case of corporate bond purchases by central banks, or indirectly by liquidity injections that boost holdings of cash by non-bank investors.”
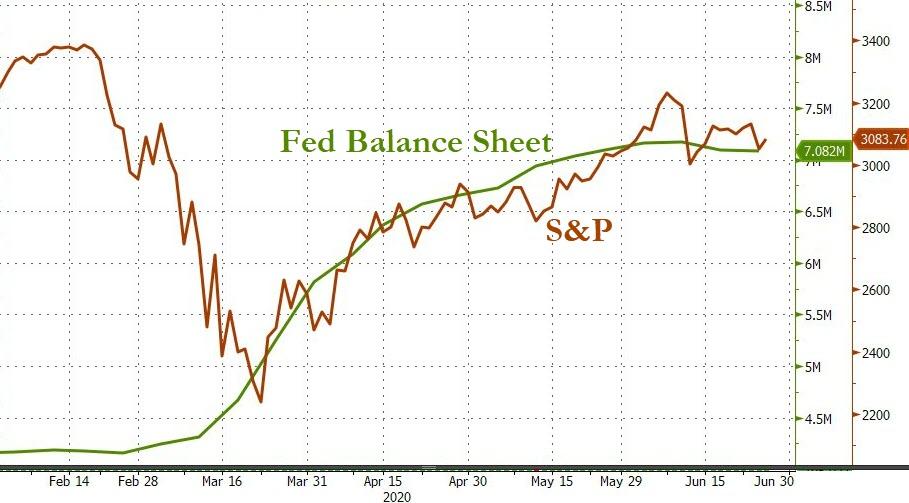
Bottom line: we live in a world where everything is disconnected from reality, from fundamentals and certainly from cash flows, and in order to keep suspending the disbelief the Fed has to inject a fresh trillion (or more) every quarter, if not every month. And with the Fed’s balance sheet now shrinking for 2 consecutive weeks, having resulted in a plateau of sorts in the S&P500…
… the only thing that can push stocks higher according to JPMorgan, is another dramatic liquidity injection.
And since we have no doubt that JPM’s observation is accurate, it means that Powell faces a two-fold problem: since the Fed chair has taken negative rates off the table (for the time being) and since the Fed today announced that Yield Curve Control isn’t coming any time soon, Powell has no choice but to boost unleash another firehose of debt monetizing liquidity in the financial system via even more QE. However, any such reversal to the Fed’s current posture of flat/shrinking QE (the Fed is now buying “only $80BN in TSYs per month, down sharply from the $1 trillion or so in March) will be met with howls of rage, especially among what’s left of the conservative political establishment. Which means that, just like in March when the Fed used the first pandemic-induced market crash to unleash unlimited QE, the Fed will soon have to go for round 2 and spark either a new market crash or await for another covid-linked market selloff, one which it then uses as a convenient pretext for the next massive liquidity injection.
Failing to do that, watch as the dollar takes off as markets sniff out that another major dollar squeeze is imminent as the front-end inverts. And since this will accelerate the liquidity crunch, one way or another, the coming $1.6 trillion in Treasury issuance – which has already been generously greenlighted by Congress – will serve as a trigger for the next market shock, one which the Fed will quickly reverse by expanding the already unlimited QE by trillions on very short notice.
The one question we have is whether this will be the market crash that the Fed uses to unveil it will also buy equity ETFs (and individual stocks) or if Powell will save this final bullet in its ammo for whatever comes next.
Yet while the Fed’s QE expansion is just a matter of time, whether catalyzed by another market crash or not, the bigger question is what happens after that?
“Can governments continue to borrow at such record levels? No,” George Boubouras, head of research at hedge fund K2 Asset Management asked in May. “Central-bank support is key in the massive bond buying we’ve seen for now. But if they blink then at some point, in the medium term, it will all likely unravel – with unforgiving consequences for some countries.”
Ironically, this also means that an end to the coronavirus crisis is the worst possible thing that could happen to a world that is now habituated to helicopter money and virtually unlimited handouts, which however need a state of perpetual crisis.
“Once there is an end to the crisis in sight, they will be less and less willing to provide support and it will fall more on the street to absorb paper,” said Mediolanum money manager Charles Diebel, who’s adding bond steepeners in anticipation of a coming inflationary supernova.
Translation: expect a major crisis in the coming months, one which gives the Fed a green light to do whatever it needs to avoid another market crash.
That, incidentally, would also be the beginning of the end for the current monetary regime, which is why anyone hoping that officials, policymakers and the establishment in general will allow the coronavirus crisis to simply fade away, is in for the shock of a lifetime.
![]()
Zero Hedge’s mission is to widen the scope of financial, economic and political information available to the professional investing public, to skeptically examine and, where necessary, attack the flaccid institution that financial journalism has become, to liberate oppressed knowledge, to provide analysis uninhibited by political constraint and to facilitate information’s unending quest for freedom. Visit https://www.zerohedge.com
