Is Joe Biden About To Send Silver Soaring
Tyler Durden
Mon, 10/12/2020 – 11:15
One of the key market dynamics over the past few months has seen traders seeking to best position their portfolios for the outcome of the presidential election, where we have seen a tug of war between tech stocks (a bet on continued deflationary forces and lower yields) on one hand, and small cap/value names which have seen some modest outperformance in recent days as a Biden victory has become synonymous with reflation (with Goldman speculating that as much as $7 trillion in new fiscal stimulus may be unleashed).
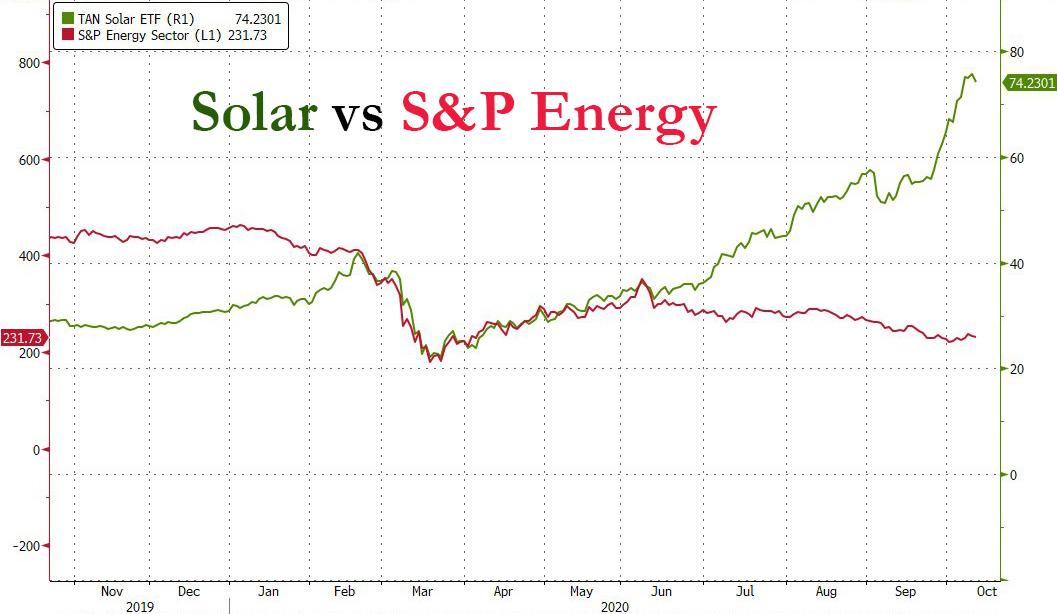
But while the broader “reflation vs deflation” trade has been widely discussed here, and elsewhere, one more targeted trade that has seen less coverage in the media has been the divergence between the legacy energy sector, represented by the S&P Energy Sector and most easily observed by the continued slide in such energy titans as Exxon and Chevron, and clean energy. The thesis is simple: a Biden administration will seek to punish “dirty” energy names while encouraging “green”, or solar, energy development. And a quick look at the recent underperformance in “legacy energy” vs the TAN solar ETF shows just how divergent positioning in this trade has been since early June.
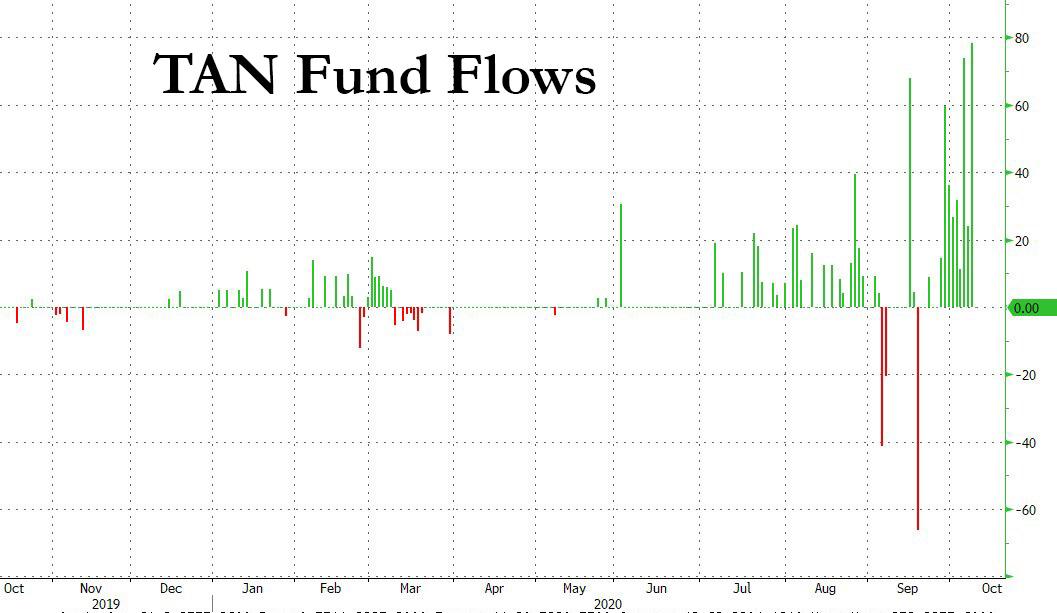
What is particularly notable about this divergence is that it again appears to be a function of Robinhood exuberance. As Bloomberg’s ETF guru Eric Balchunas writes, TAN has become “the Robinhood crowd’s new plaything as evidenced by the shattering of its weekly volume w/ $1b (top 2% among all ETFs).”
$TAN is Robinhood crowd’s new plaything as evidenced by the shattering of its weekly volume w/ $1b (top 2% among all ETFs). Record inflows too, aum now over $2b. $ICLN is sidekick seeing outsized interest as well esp w options. h/t @SarahPonczek pic.twitter.com/jDmS7Al5Nd
— Eric Balchunas (@EricBalchunas) October 9, 2020
It’s not just record volumes, but record inflows too, with the ETF’s AUM now over $2BN following several weeks of nonstop inflows.
As Balchunas further notes, while Tan is up over 230% since March – making it one of the best performing ETFs of 2020 – “and is now getting extra kick from potential Blue Wave=green energy spend hopes”, it is still down 67% since inception. So lots more upside here.
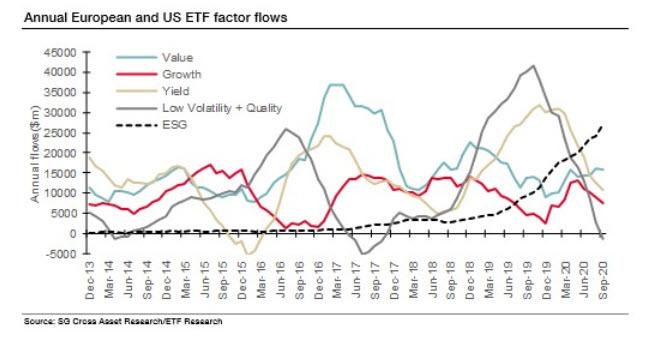
Of course, since solar stocks are in the “virtuous” category, these inflows will also count toward ESG assets, which as SocGen’s Andrew Lapthorne recently showed, have become the dominant factor for capital inflows. As Lapthorne recently wrote on the SocGen blog, “the trend is clear and whilst flows into equity factors (aka Smart Beta) product has remained fairly stable over the last 12 months (though low volatility/quality is a notable exception), ESG flows continue to rise month-on-month.” Whether it is due to bets on a “green” Biden admin or some other reason, but the ESG ETF category is now 50% of the AUM of the Value, Growth and Yield categories but, as Lapthorne notes, it has been around for far less time “and over the last year the flow into ESG ETFs has almost matched all the flow into the equity-factor based products.”
But back to TAN, which having emerged as the clearest beneficiary of the recent retail “green stock” euphoria, may also lead to the unintended consequence of sending silver surging in coming weeks.
As Goldman’s Mikhail Sprogis explains, “with global infrastructure stimulus tilting towards renewables, and solar in particular, silver stands out in the metals space as the obvious beneficiary. Solar investment accounts for around 18% of silver industrial demand, or 10% of silver total demand.” As a reminder, previously Goldman we argued that bullish exposure to solar is an important component in the bank’s $30/oz target (in addition to sharply higher gold prices on currency debasement).
Below we present some more thoughts from Goldman why the continued green frenzy could soon send silver sharply higher:
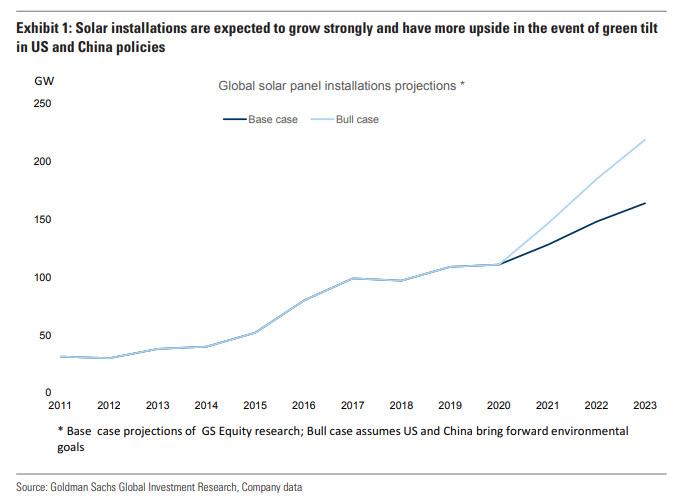
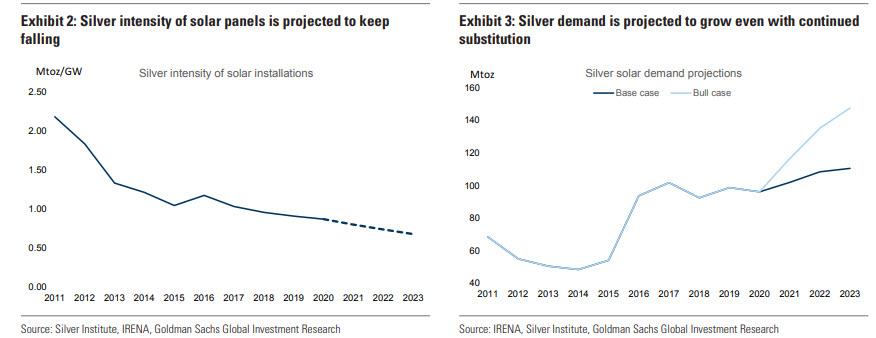
Our Equity analysts’ base case is that global solar installations will increase by 50% between 2019 and 2023 as the greenification trend accelerates. Importantly, there are potential upsides even to this ambitious target. Former US Vice President Biden has proposed a plan which involves installing 500 million solar panels in the US alone over the next 5 years. Our Equity analysts estimate that this could boost installation of US capacity from 15 GW per year to 30 GW. This represents a boost of almost 15% to global solar installations. Importantly, our Chinese clean energy team see potential upside to Chinese solar panel installations in the new 5-year plan. In their view, Chinese installation could reach 93 GW per year vs the current figure of 50 GW. This would represent a 40% boost to global installations.
The expected surge in solar installations per Goldman’s two cases – base and bull – is shown below:
Of course, this aggressive expansion in solar facilities would mean far more demand for silver, and sure enough Goldman calculates that “silver demand should see decent growth” over the next 3 years, “although this could be significantly boosted should the Chinese and Biden-driven renewable acceleration happen. All in all, Goldman concludes that over the next 3 years solar should boost silver total industrial demand by 2% in the base case and by 9% in a bull case.
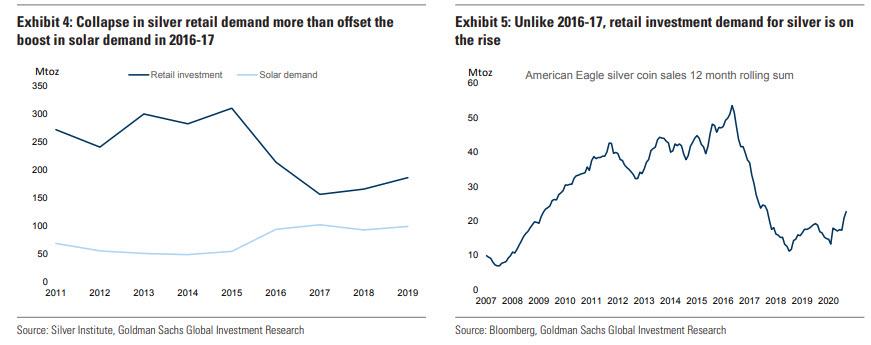
This won’t be the first time that silver solar demand has been a key price catalyst: it also happened in 2016-2017 but back then it led to only a brief period of silver outperformance vs gold, with Goldman explaining that the key reason for this was that the boost in industrial demand occurred simultaneously with a material decline in retail investment demand as the global economy entered the recovery stage, incentivizing a large rotation out of precious metals, and as such “the collapse in US retail demand was a key driver of the weakness.” However, this time around retail demand is actually increasing from a depressed level as the cyclical/inflationary risks facing the global economy are incentivizing more investment into precious metals, and silver in particular.
Furthermore, Goldman has calculated that while historically fluctuations in investment demand are the most important driver of silver prices, industrial demand matters too (silver’s beta to gold is around 1.55, while its beta to industrial demand is 1.07.) This means that if solar is successful in boosting industrial demand by 9%, this should lead to a 10% increase in silver prices, all else equal. And while this may seem small compared with the demand price relationship for base metals, Goldman’s analysts think it is reasonable given that a) silver industrial demand is only half of total demand; and b) jewelry, silverware and scrap are quite price-responsive and can be pushed out by higher industrial use. Also, a material tightness-driven rally, akin to 2011, should be prevented for now by the still very high level of on-ground stocks.
What does this mean for silver prices?
Well, according to the bank, in the event that both the Biden- and China policy-driven solar acceleration do materialize, Goldman’s model points to a 9.3% boost to its silver target. In addition, “solar is top of mind for most silver investors and, as such, any news flows that could be positive for silver, such as a Biden victory, could generate a rotation into the metal.”
Bottom line: Goldman once again goes long silver, expecting the precious metal to hit $30 in the coming months.
Earlier this year we initiated a long silver trade recommendation, and then closed out of after silver prices rallied by 50%, briefly touching our $30/toz target. Now, with silver at $24/toz and a few potential upward solar surprises in the coming months, we reopen the trade.
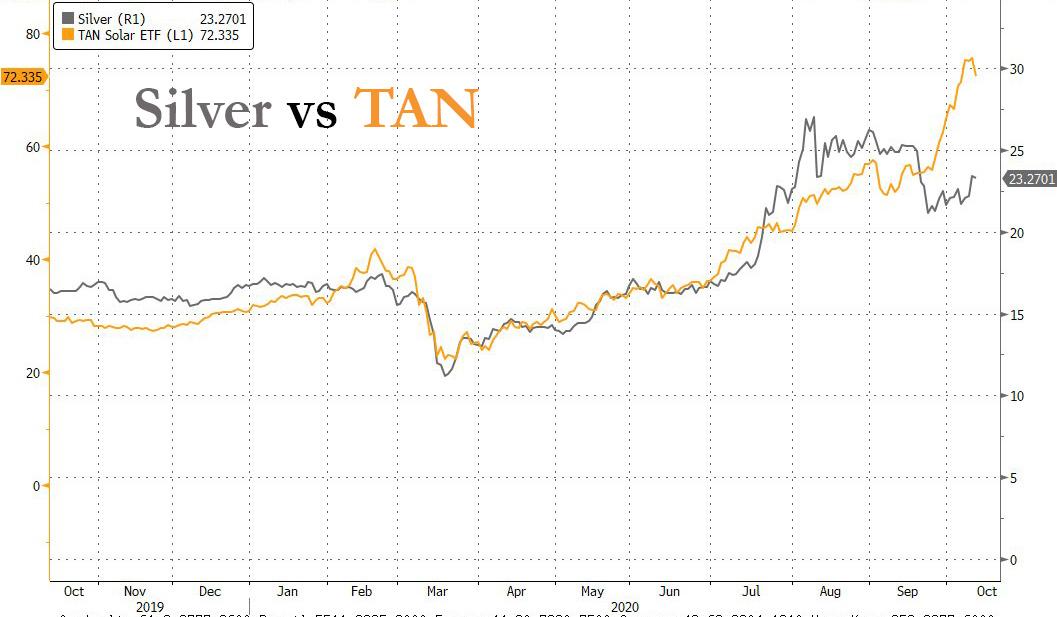
Goldman’s target may be conservative: one look at a chart of TAN vs Silver shows that if and when TAN’s momentum migrates to silver, $30/oz may be just the start.
![]()
Zero Hedge’s mission is to widen the scope of financial, economic and political information available to the professional investing public, to skeptically examine and, where necessary, attack the flaccid institution that financial journalism has become, to liberate oppressed knowledge, to provide analysis uninhibited by political constraint and to facilitate information’s unending quest for freedom. Visit https://www.zerohedge.com
