A Bizarre Discrepancy Emerges In The Trade Data Between US And China
Tyler Durden
Mon, 12/07/2020 – 11:30
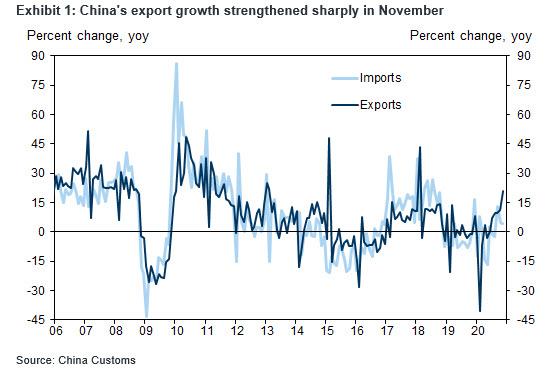
Overnight, China reported its latest trade data for the month of November which was, in a word, blockbuster: exports accelerated sharply to 21.1% Y/Y (from 11.4% Y/Y) in October driven by a surge in covid-related exports, with sequential growth up to +5.1% month-on-month; Imports moderated slightly in November and grew 4.5% Y/Y (1.0% month-on-month non-annualized expansion), compared with the 4.7% Y/Y increase in October (although as Rabobank’s Michael Every cautions, many of the imports were of soft commodities vs. higher value-added goods).
In any case, the result was a record monthly goods trade surplus in November of $75.4BN, which below above consensus expectations of $46.3BN and was well above the October surplus of $58.4BN.
Digging into the number, exports of Covid-19 related products surged in November due to the resurgence of coronavirus in most major economies: exports of textile & fabric goods grew 21.0% Y/Y, vs 14.8% Y/Y in October, while “working from home” related exports accelerated as well – growth of exports in automatic data processing machines accelerated to 34.3% Y/Y in November vs 26.7% Y/Y in October. Growth of exports in electronic integrated circuits also improved to 26.4% Y/Y in November from 13.9% Y/Y in October. Exports of plastic articles remained strong and grew 112.9% Y/Y vs 97.9% Y/Y in October. Housing related exports accelerated further – exports of furniture grew 41.9% Y/Y vs 32.3% Y/Y in October.
But while the overall trade numbers were impressive, if not for positive reasons since China’s export boom continues to be driven by covid-related demand – yes, the same covid that was unleashed by, well, China – what was most remarkable in the latest data set released by China’s National Bureau of Statistics is that exports to the US surged 46.1% in US Dollar terms, putting the monthly bilateral surplus ($32.8bn) above levels observed at the end of 2019 (just as the US/China Phase 1 deal was being finalized); as BMO’s Stephen Gallo writes, “From the perspective of that agreement, the US/China bilateral balance has been trending in the wrong direction (helped by the effects of COVID-19). Merchandise exports to the US, as a share of total exports, ended 2019 at 13.6%, but they were back to 17.6% as of November 2020.”
In short, after the US made some headway in its trade war with Beijing, all that progress and more is now gone as Chinese net exports are steamrolling ahead… thanks to covid.
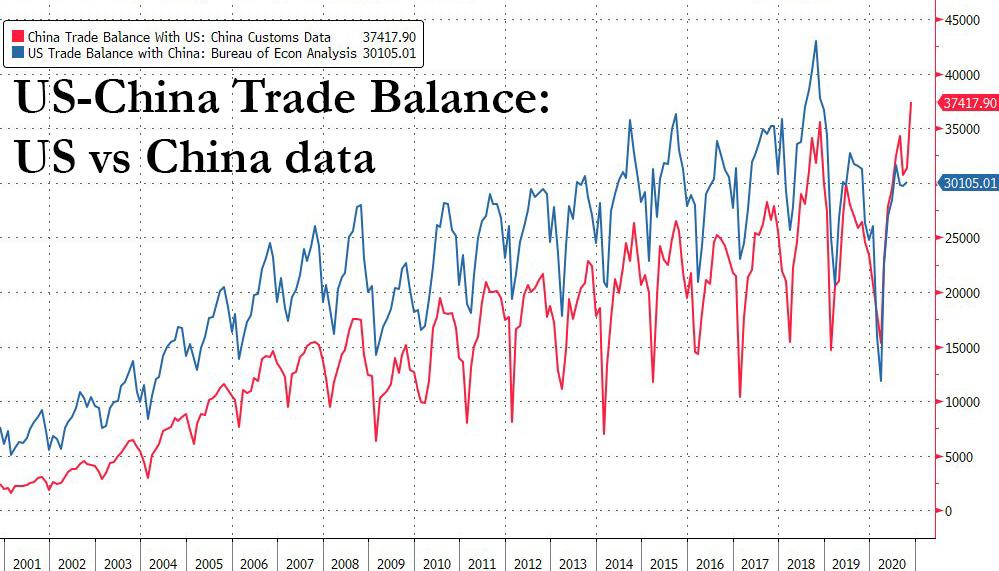
Yet here an interesting observation emerges: while the trade surplus with the US according to China Customs data indeed hit a record high, US Bureau of Economic Analysis data shows something quite different, and this deiscepancy is showin the chart below:
This is, to say the least, strange: after all data is data, and when one using the same nominal amount of trade exports and imports between the two countries engaging in trade, one should – in theory at least – end up with the same trade surplus (and respectively deficit) number.
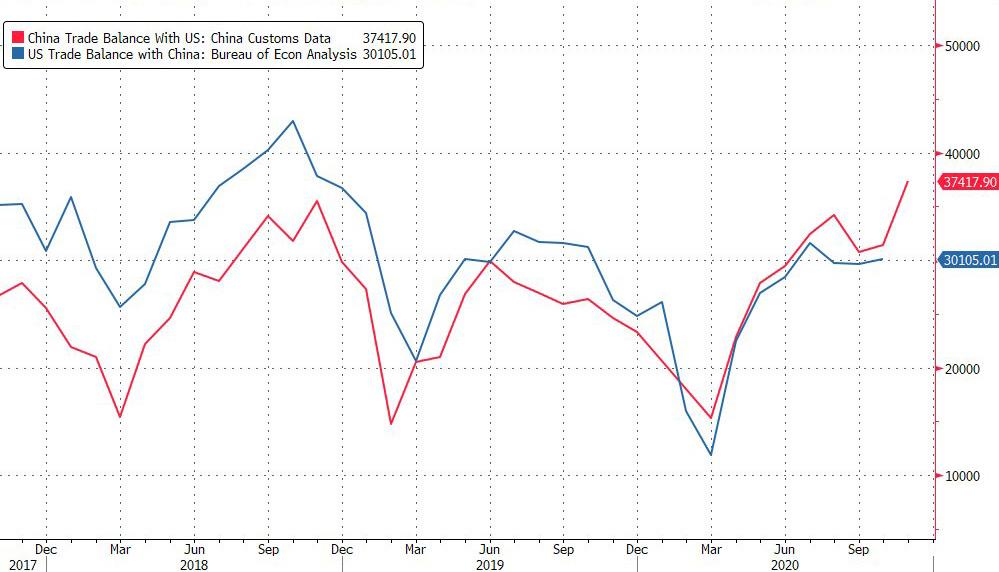
Alas, as the chart above shows, not only has that has not been the case for the past two decades, but curiously, after years of US data showing a larger bilateral deficit with China than the Chinese data shows a surplus with the United States (largely due to the so-called Hong Kong port effect which explains much of the discrepancy), this has reversed in the past few months when China’s reported exports to the United States have significantly exceeded reported U.S. imports (the exact opposite of the established pattern). This can be seen clearly in the chart below which is a zoomed in portion the bilateral trade balances shown above:
This phenomenon which has escalated drastically in recent months, was first pointed out by former Treasury official Brad Setser who pointed out the data discrepancy in an October blog post , writing that “there is no doubt there is a gap. In July 2018, China said it exported $41.6 billion to the United States, and the United States reported importing $47 billion from China. In July 2019, China said it exported $38.9 billion to the United States (down because of the tariffs), and the United States reported importing $41.4 billion from China. And in July 2020, China said it exported $43.7 billion to the United States, while the United States only reported importing $40.7 billion from China.”
As a result, as Setser adds, “the answer to a lot of politically-salient questions—for example, is the bilateral trade deficit with China larger or smaller now than in 2016?—hinges on whether you use the U.S. or the Chinese data. “
If you look at the Chinese data, its current monthly surplus with the United States is at an all-time high for the months of July and August, topping its pre-trade war peaks by substantial margins
In the U.S. data, the July deficit with China and Hong Kong (adding in Hong Kong reduces the size of the deficit as the United States runs a surplus with HK) is only just above its 2016 levels.
Fast-forwarding two months to the latest December data only shows that this divergence has accelerated with the latest Chinese data showing yet another record surplus for the month of November.
To be sure, and as one can easily see in the charts above, the gap between China’s reported exports to the United States – red line – and reported U.S. imports – blue line – plus the larger deficit when reported from the U.S. side than the surplus on the Chinese side, has been a long-standing pattern. It reflects the previously discussed role of Hong Kong in U.S.-China trade, because as Setser explains, “a lot of what China records in its data as an export to Hong Kong historically has ended up in the U.S. data as an import from China, and a lot of what the United States reports as an export to Hong Kong has historically ended up in the Chinese data as an import from the United States.”
What is novel here is the change in the pattern – the long established and well-understood discrepancy between the import and export side data has gone away.
The puzzle, as Setser wrote, “is why the sign on the discrepancy looks to be flipping.” There are two possible explanations which immediately come to mind.
Chinese exporters might be overstating their exports, in general and to the United States. Overstating exports is a classic way of getting capital into a country with capital controls.
However, a simpler explanation is that the US tariffs have created a strong incentive for firms importing into the United States to go to some lengths to understate their imports from China. Thus, U.S. imports from China are now likely under-counted (which by implication holds the bilateral trade deficit down).
As Setser concludes, while “mapping one country’s import data to a partner’s export data” is a dull but exercise, “sometimes it yields interesting results. A similar exercise back in 2015—the Chinese current account surplus stopped tracking the goods balance—led me to look at whether the reported increase in tourism imports in the Chinese data was matched by a rise in the number of actual tourists (it wasn’t) and ultimately produced quite a good Fed paper.” We are confident that economists looking at the growing discrepancy in trade data between the US and China will soon be busy coming up with their own theories, even if the real answer why this most critical trade relationship in a world where the US-China trade war has been the overriding theme for much of the past 4 years, will likely remain a mystery.
![]()
Zero Hedge’s mission is to widen the scope of financial, economic and political information available to the professional investing public, to skeptically examine and, where necessary, attack the flaccid institution that financial journalism has become, to liberate oppressed knowledge, to provide analysis uninhibited by political constraint and to facilitate information’s unending quest for freedom. Visit https://www.zerohedge.com


