BofA “Sell” Signal Triggered Any Moment… The Last This Happened Time Was June 2007
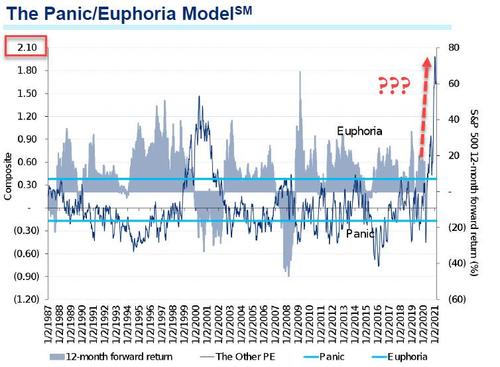
Back in mid-December, when stocks were melting up furiously daily amid unprecedented retail euphoria, which would only get crazier and crazier until eventually it forced Citi to use a bigger chart two months later to capture the market’s retail euphoria…
… we reported that Bank of America’s first proprietary sell signal since February 2020 was triggered:
According to BofA., equity “barbell” strategies all the rage while (the few remaining) bears note cash levels fall to 4.0%, triggering an FMS Cash Rule “sell signal”; The last time the sell signal was triggered was in February 2020 – everyone knows what happened next.
Fast forward two and a half months and one sharp correction in stocks later, when yet another BofA sell signal has been triggered.
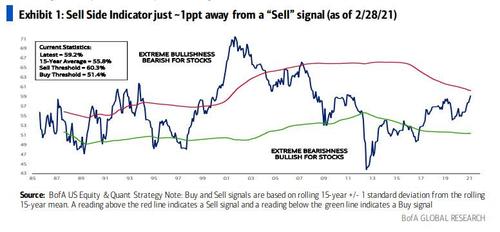
As BofA’s Savita Subramanian writes overnight, Wall Street strategists continued to increase their recommended equity allocations in
February. As a result, the Sell Side Indicator (SSI), which is the average recommended equity allocation by sell-side strategists, rose by nearly 1ppt to 59.2% from 58.4%. This was the second month in a row of an almost 1ppt jump, bringing recommended equity allocation to almost a 10 year high and just 1.1ppt shy of what BofA dubs a “Sell” signal.
Why is this important? Because the last time the indicator was this close to “Sell” was June 2007 after which we generally saw 12-month returns of -13%. No wonder why Subramanian concludes that “we’ve found Wall Street bullishness to be a reliable contrarian indicator.”
Tyler Durden
Tue, 03/02/2021 – 10:31![]()
Zero Hedge’s mission is to widen the scope of financial, economic and political information available to the professional investing public, to skeptically examine and, where necessary, attack the flaccid institution that financial journalism has become, to liberate oppressed knowledge, to provide analysis uninhibited by political constraint and to facilitate information’s unending quest for freedom. Visit https://www.zerohedge.com

