“It’s Gone Parabolic”: Canadian Housing In One Shocking Chart
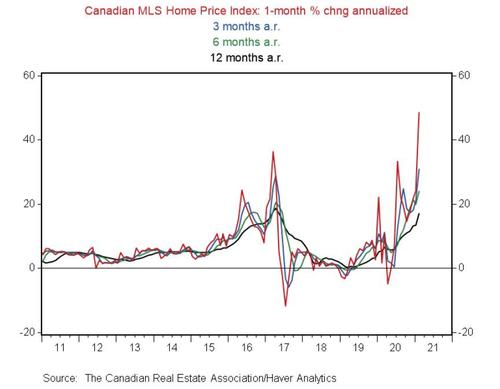
It probably does not need much commentary, but as BMO Senior Economist Robert Kavcic writes in his morning charts, “if it’s not fully apparent to all parties that the Canadian housing market is boiling, this picture might convey the message…”
Kavcic urges readers to note the acceleration: “that is, the 1-month change is faster than 3-month; which is faster than the 6-month; which is faster than the 12-month. In all cases but the 12-month (and that won’t be long either), price growth has accelerated through the rates seen in 2017, when policymakers were working on multiple fronts to tame the market.”
* * *
Curious for more: here are some facts on the state of Canada’s overheating housing market courtesy of BMO:
Canadian Existing Home Sales (Feb.) — The Wild North
Canadian existing home sales rose 6.6% in seasonally-adjusted terms in February, setting yet another record level. From a year ago, sales were up a hefty 39.2%, and the gains are about to look even more gawdy once we see comparisons to March, April and May (recall that the market was locked down last year). We’ve discussed at great length the factors that are driving record demand, but in case you’re new to the scene, here’s a quick refresher:
- Employment in higher-paying industries recovered swiftly, supporting incomes among potential homebuyers.
- Mortgage rates plumbed record lows and, while they’re backing up now, they’re still below pre-COVID levels, while many buyers are likely still on pre-approvals with rates locked in.
- There’s has been a dramatic shift in preferences toward more space, further outside major urban centres (commuting requirements are down, and probably assumed to remain down).
- Limited travel has created historic demand for second (recreational) properties, and households have equity in existing properties to tap.
- Younger households are likely pulling forward moves that would have otherwise happened in the years ahead.
- There has to be some FOMO and speculative activity in the market at this point (which is, unfortunately, tough to show with hard data until after the fact).
On the flip side, there is precious little supply to meet that demand, at least in segments that the market wants. New listings actually jumped 15.8% (seasonally adjusted) in February, but the 11% gain from a year ago still trails well behind sales. More importantly, the standing inventory on the market remains almost non-existent by historical standards. The months’ supply of homes for sale across the country hit a record low of 1.8 in the month (the norm is about 5). Even if we re-set the sales pace to pre-COVID norms, we’d still only have about the half the normal supply on the market. Why? Here’s another quick refresher:
- Mobility is down, so it stands to reason that listings (i.e., movement) are down, particularly for those in desirable locations to ride out the pandemic.
- The past 15 years or so have been characterized by intensification, with new condo development running at twice the rate of that for single-detached homes – that’s not what the market wants right now.
This leaves us with a perfect storm for higher home prices outside the major-city condo sector. The MLS benchmark price jumped 17.3% y/y in February, within reaching distance of the 2017 high (when policymakers were working on multiple fronts to cool the market). Annualized growth over the past six months was even stronger at 24%; and month-over-month, price growth in February alone was the strongest on record (dating back to 2000). In other words, parabolic.
Regionally, almost all of the country is participating, with sales up by double-digits or more in all markets outside Quebec (that market is not weak by any means). Meantime, 22 of 26 major markets have seen the average transactions price rise by double-digits, with 20%-to-40% gains common. Markets that entered the pandemic in a position of strength (e.g., Toronto, Ottawa and Montreal) have strengthened further, while markets that were in the doldrums (e.g., Calgary, Edmonton, to a lesser extent Vancouver) have re-emerged. And, the strongest momentum is in what we can loosely call “cottage country”, with average price gains in some locations running around 50% y/y.
In a separate release, Canadian housing starts pulled back to 245,900 annualized units in February, a still-high level following a near-record print in the prior month. Just so we’re clear that this is not a winter wonder, starts on a twelve-month average basis are running at 227k annualized, the strongest such pace since 2008; and over the past six months, starts are averaging 242k, the highest since at least 1990. Both single- and multi-unit starts declined in the month, as did all provinces but British Columbia.
The Bottom Line: It should be fully apparent to all parties that the Canadian housing market is boiling, with strength across most markets, and extreme conditions in some.
Tyler Durden
Tue, 03/16/2021 – 21:05![]()
Zero Hedge’s mission is to widen the scope of financial, economic and political information available to the professional investing public, to skeptically examine and, where necessary, attack the flaccid institution that financial journalism has become, to liberate oppressed knowledge, to provide analysis uninhibited by political constraint and to facilitate information’s unending quest for freedom. Visit https://www.zerohedge.com
