Indicators Of Market Bottom Are Still Missing
By Michael Msika and Jan-Patrick Barnert, Bloomberg Markets Live Commentators and Reporters
In a market rattled by mounting risks, intense selloffs followed by meager relief rallies are making trading challenging. The bad news: some indicators of a floor are still missing.
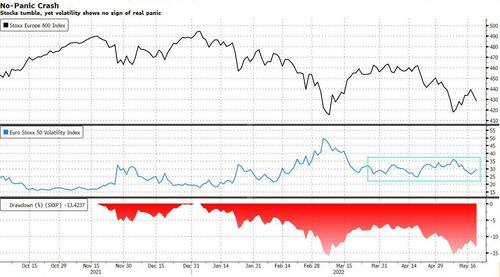
This month’s rout has been accompanied by unusual volatility measures. While swings are certainly elevated, they aren’t yet showing the type of panic that would be expected given some of the market’s recent moves. Peaking volatility has typically been a reliable indicator for dip buying, but this is currently missing.
Equities have made some attempts to rebound from recent lows, but moves haven’t been convincing. High inflation is proving difficult to tame, pushing central banks to turn more hawkish and adding to already elevated concerns about economic recovery.
While a recession in Europe isn’t yet the base case for most strategists, they have been lowering their growth forecasts. This hasn’t yet been reflected in earnings, making stocks look artificially cheap.
“The correction in equity markets has really mostly been due to adjustments in valuations,” HSBC strategists led by Max Kettner say, adding that risks to growth have been underestimated so far. “We think the next couple of months will see the growth shock dominating the real-rate shock,” he says, reiterating an underweight stance on equities.
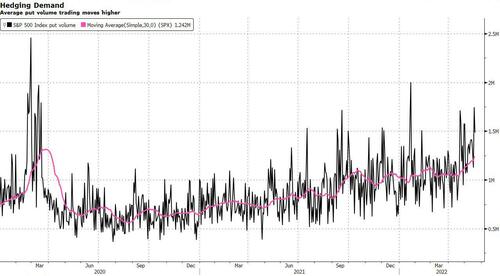
Against this backdrop, traders keep increasing their hedges. The gradual increase in average put volume is somehow worrying. About 1.2 million contracts are traded daily right now, almost double the 30-day average a year ago. But there’s been no extreme reading in put volumes yet to indicate that maximum fear is priced in.
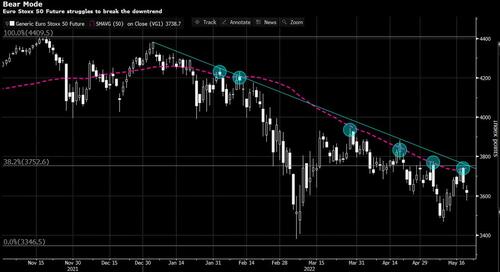
In the short term, the technical picture remains skewed to the downside, with the Euro Stoxx 50 future index unable to break its downtrend or make any higher highs. “The 50-day moving average together with the 38.2% Fibonacci retracement is a significant resistance,” says Fuerst Fugger Privatbank technical analyst Christian Curac.“It is probably still too early to significantly increase equity allocations,” he says.
Some strategists are more optimistic, or at least less pessimistic. Bloomberg’s monthly survey suggests the Stoxx Europe 600 will end the year down 2.5%, implying upside from current levels, while those at Goldman and JPMorgan see fears of recession in the US as overblown.
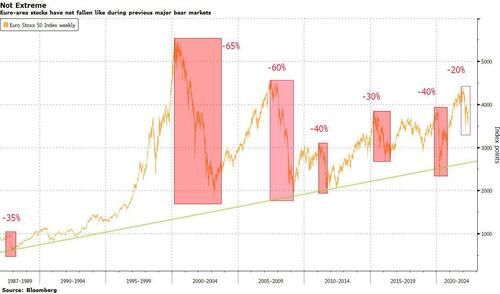
But there is also the potential for the extreme bear case. During prior major financial market crashes since 1987, the Euro Stoxx 50 fell 45% on average from peak to trough, according to Bloomberg calculations. We’ve seen about a 20% drop so far.
Aurel cross-asset sales trader Gurmit Kapoor highlights that on the Stoxx 50’s weekly long-term chart, such a drop from the 4,400 peak would bring the index almost exactly to its long-term trend line at about 2,500 points. “Anything can happen,” he says.
Tyler Durden
Fri, 05/20/2022 – 10:29
Zero Hedge’s mission is to widen the scope of financial, economic and political information available to the professional investing public, to skeptically examine and, where necessary, attack the flaccid institution that financial journalism has become, to liberate oppressed knowledge, to provide analysis uninhibited by political constraint and to facilitate information’s unending quest for freedom. Visit https://www.zerohedge.com


