Here Is What the Fed’s New Dot Plot Will Look Like
by Ven Ram, Bloomberg markets live reporter and strategist
The Federal Reserve’s revised dot plot that will be unveiled Wednesday will acknowledge the need for policymakers to raise rates higher than previously anticipated in order to put the inflation genie back into the bottle.
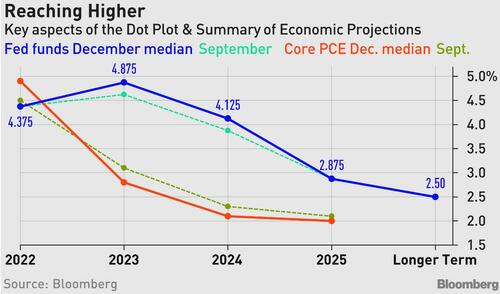
The dot for next year is likely to show the median at 4.875% compared with the 4.625% estimated in September. A number even higher than that would spur an immediate selloff in Treasuries — especially at the front end — though slower-than-forecast inflation for November may stay the Fed’s hand from doing so.
A few hawkish members may see the number slightly higher than the baseline projected above, though it’s far from clear if their weight will suffice to shift the median.
And while some of the plot distributions for 2023 may show a few members penciling in a higher terminal rate, it is worth keeping in mind that the dots reflect year-end estimates.
The median dot for 2024 may show a rate of 4.125%. That will mark a revision from the current 3.875%, with the reason for the change likely being a reflection of the Fed’s keenness to avoid premature rate cuts in the face of inflation that is still way above target.
It will also be the most efficient way of signaling against a premature loosening of financial conditions. The Fed may be particularly keen to do so in the context of November’s inflation numbers: while policymakers will take heart from slowing price pressures, an annual increase of 7.1% on the headline number is still way above the Fed’s target.
The outlook for dots suggests the core PCE inflation projected for 2023 may show a marginal improvement but still be projected at 2.8% (from 3.1% in September) and 2.1% in 2024.
Apart from the Fed funds rate dots for 2023 and 2024, which will be key to the markets’ reaction (2025 is more guesswork at this stage), the Fed’s GDP projections will be parsed keenly.
While there seems to be little doubt that the median estimate for economic growth next year will be revised lower from 1.2% in September, the question is by how much. The median estimate of economists polled by Bloomberg is a mere 0.4%, though the Fed may project a superior number. After all, Chair Jerome Powell still believes the monetary authority can engineer a soft landing even though he has acknowledged that the path is getting narrower.
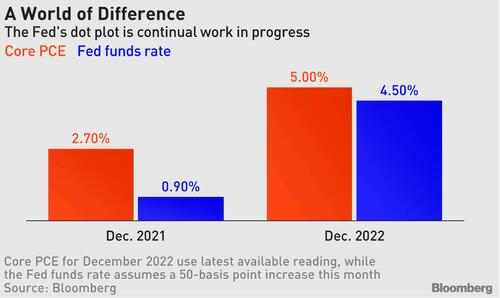
Whatever the projections on the funds rate and inflation, it is extremely unlikely that the actual levels at the end of 2023 will look anything like what the Fed projects. Just think back to what the Fed projected for core PCE and the Fed funds rate as recently as December last year. Here’s what it estimated and how it actually panned out:
All these mean that front-end Treasuries shouldn’t look for a premature rally, while an economy losing momentum quickly means that the pace of declines in long-dated maturities may slow. For currencies, a new paradigm may emerge.
All told, the Fed’s December dot plot will grip the market’s imagination for a longer time, not least because the monetary authority doesn’t meet again until February.
Tyler Durden
Wed, 12/14/2022 – 07:20
Zero Hedge’s mission is to widen the scope of financial, economic and political information available to the professional investing public, to skeptically examine and, where necessary, attack the flaccid institution that financial journalism has become, to liberate oppressed knowledge, to provide analysis uninhibited by political constraint and to facilitate information’s unending quest for freedom. Visit https://www.zerohedge.com

