Ghosts Of 2000 And 2007 Market Tops Are Absent Today
Authored by Simon White, Bloomberg macro strategist,
Today’s stock market is exhibiting few of the warning signs that were present at the market tops in 2000 and 2007.
There is a growing cottage industry in comparing today’s equity market to the bursting of the tech bubble in 2000 and the financial crisis beginning in 2007. But it is the differences that are more notable than the similarities.
If today’s market does go on to make new lows, it’s unlikely to be for the same set of reasons as in those two prior episodes. Cautious bullishness is therefore advised.
It’s obviously handy if you can gauge when a market top is close. Each one is different, but they often tend to share several features. Signs of corporate exuberance; valuations at extreme levels; weak leading economic data that is worsening; and sentiment and positioning that are very stretched are all common signs a peak is near.
The 2000 and 2007 market tops are canonical in many respects, but several key features of today’s market are sufficiently different to render any comparisons inadequate:
-
Less corporate excess as the effects of rate hikes are dampening activity
-
Liquidity and financial conditions are improving, not deteriorating
-
More supportive technicals
-
Sentiment and positioning are less extreme
Both 2000 and 2007 were marked by extremes in corporate behavior that are not as marked today.
Rapid rises in M&A, IPOs, leveraged buyouts, share buybacks and money raised for venture capital and private equity were seen around these periods, but in this cycle the extremes were in 2021 and 2022 and are thus mostly behind us.
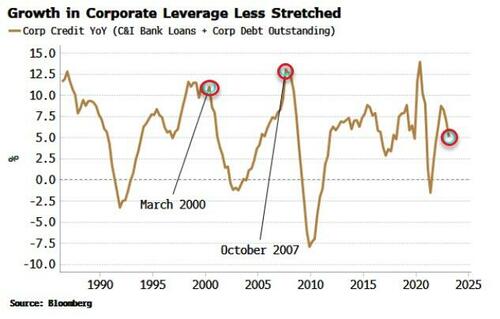
Growth in corporate credit (bank loans and corporate bonds) was considerably higher in 2000 and 2007 than it is today (2020 was an anomaly due to pandemic-loan assistance). M&A activity also saw peaks in 2000 and 2007, and again in early 2022, but is considerably lower now.
The reality is the 500 bps of Fed rate hikes since last year have already taken the edge off some of the worst excesses of leverage and corporate activity.
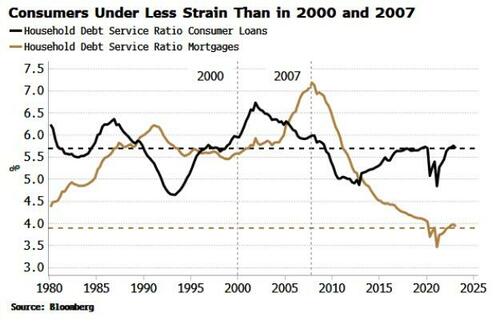
Also, the household sector is in a less precarious position than in 2000 or 2007. The GFC, especially, triggered a deleveraging in the household sector that has continued to this day.
Despite the rapid rise in interest rates, consumers’ debt-service ratios are lower now than in 2000 and 2007 for loans and for mortgages.
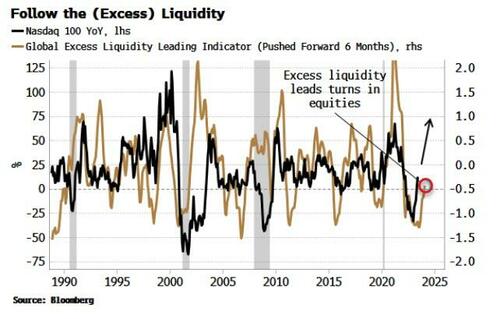
Most pointedly, liquidity is more supportive for stocks today. Regular readers of this column will know I spend a lot of time on excess liquidity – the difference between the growth in money and real economic growth – and that is because it is the best medium-term leading indicator for equities and other risk assets.
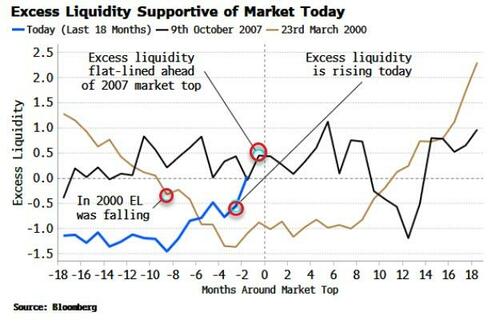
In 2000 and 2007 excess liquidity was not as supportive. While its level was relatively high, in 2007 it was moving sideways, and in 2000 it had been falling. This year it has been rising and, arguably, supporting the impressive recovery in stocks.
One of the most notable differences between today and previous market tops is technicals that are signalling the beginning of a new trend, rather than the ending of an old one.
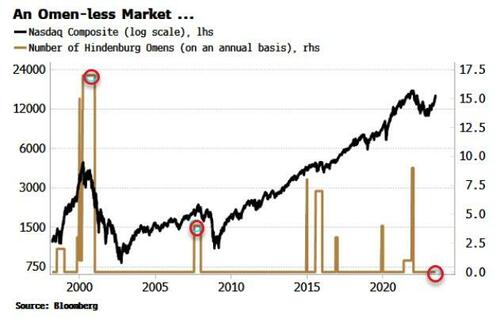
The Hindenburg Omen is a well-known technical indicator based on stocks making new one-year highs and is designed to forecast crashes. The chart below counts the number of them on an annual basis for the Nasdaq Composite. As can be seen, the number of omens before the 2007 top and especially before 2000’s was elevated. Today there are zero.
On top of that, one of best long-term indicators of stock-market returns, the Coppock, triggered in March. It has previously activated at some of the best buying opportunities, such as October 1982, August 1988, April 2003 and August 2009. It was notably absent in March 2000 and October 2007.
Furthermore, on a swathe of breadth, positioning and sentiment indicators today’s market is not as vulnerable as in 2000 or 2007. The table below shows running percentiles for measures of stock-market sentiment and breadth.
Despite 2023’s rally initially being driven by only a handful of stocks, it is broadening out and looks more resilient than the 2000 and 2007 rallies. We can build scores for breadth, sentiment and positioning, and on this basis today’s market is overall less unrestrainedly bullish and not as invested as it was in the run-up to the previous market tops.
In one way today’s market does look as stretched as it was in 2000 and 2007, and that is on measures of long-term valuation. Cyclically-adjusted P/E, price-to-sales, price-to-book, total market cap-to-GDP and Tobin’s Q (a company’s value relative to its replacement cost) are all either not much lower or higher than they were at the previous market peaks.
Nonetheless, as has been amply demonstrated in recent years, the market can remain overvalued longer than most can stay solvent.
Tempered bullishness is thus the policy advised for this market, but if the same fate befalls it as happened in 2000 and 2007 – and anyone says “I told you so” – it’ll be more a case of being lucky than smart.
Tyler Durden
Thu, 06/22/2023 – 15:05
Zero Hedge’s mission is to widen the scope of financial, economic and political information available to the professional investing public, to skeptically examine and, where necessary, attack the flaccid institution that financial journalism has become, to liberate oppressed knowledge, to provide analysis uninhibited by political constraint and to facilitate information’s unending quest for freedom. Visit https://www.zerohedge.com
