Transitory Or Not: Three Factors Will Determine If Skyrocketing Prices Are Here To Stay
Transitory or not transitory, that is the question.
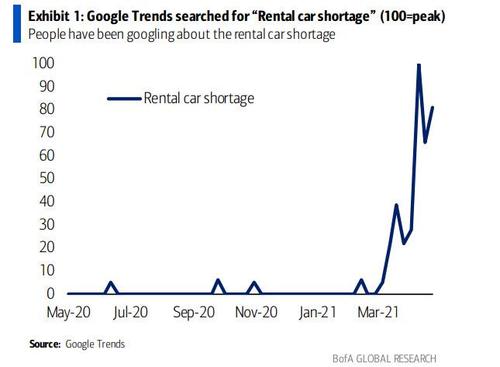
The challenges from cracking supply-chains and the resulting strain on production and inventory are being felt widely. If you are looking to furnish a home, you have probably dealt with major delays in the delivery of your new sofa and may instead be sitting on beanbags. If you are looking to buy a car, you might be walking out with the sticker price and the wrong color. And good luck if you are trying to rent a car: if only Hertz had waited a year to file for bankruptcy it would be worth tens of billions today.
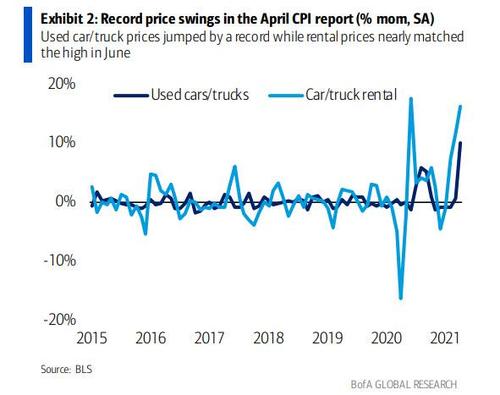
The latest scorching CPI report highlighted these challenges, revealing a record 10% mom increase in used car prices and 16.2% spike in rental car prices, which was second only to June last year.
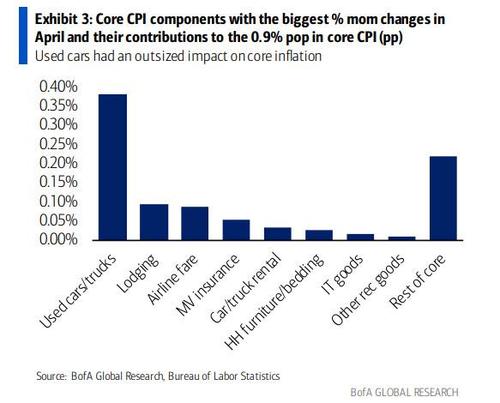
More broadly, core CPI jumped 0.9% mom SA, the biggest monthly gain since 1981 with record increases in a number of categories. Indeed, 0.7pp of the gain in core CPI owed to just eight categories with used car/truck prices having an outsized contribution of 38bp.
As Bank of America notes, the auto sector is especially interesting as the ongoing chip shortage has led to a historic drawdown in real retail inventories (explored in detail later),as auto manufacturers have been forced to cut back production. This helps explain the strength in used car prices, up 10% mom in April. Typically a source of a supply for used cars, rental companies are holding onto their fleets amid the rebound in travel demand and are actually purchasing used cars, adding further pressure in the market. Indeed, Manheim wholesale used cars prices spiked another 8.3% mom in April, building on the 11.2% increase from January through March. This argues for another huge shock to core CPI in coming months from used cars. Rental companies have also jacked up their rates, up 16.2% mom in April, given these frictions.
The chip shortage has not only affected autos, but production of other goods as well including computers, represented in IT goods prices (+3.6% mom in April). Household furniture & bedding also saw a notable price increase of 2.1% mom, though real I/S ratios for furniture retailers have only edged down slightly as of February, driven by stronger demand.
The rebound in travel demand and driving has additionally boosted lodging (+7.6%), airline fares (+10.2%), and motor vehicle insurance prices (+2.5%). Lodging and airline fares were beaten down during the pandemic and remain 4.9% and 17.7% lower than pre-pandemic levels, suggesting significant scope for a rebound. So, as we head into the peak summer travel season, even Bank of America warns that “prices could continue to skyrocket.“
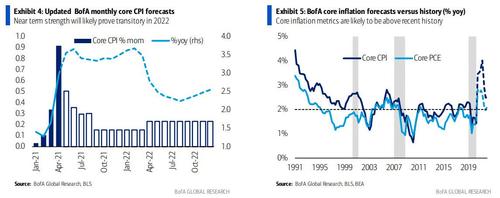
Considering these dynamics, core inflation is likely to be particularly robust through August but then ease as we head into year-end, with some risk of a negative payback on a mom basis given the noise. As a result, BofA has updated its core CPI trajectory as shown below, which will lead the % yoy rate to surge to a high of 3.7% in June before moderating to 3.5% in December (3.4% 4Q/4Q). On a sequential basis, the April surge is the peak, with the May print expected to come in at just about half, or 0.5% mom. That said, BofA views these price pressures as “transitory” with core CPI cooling down to 2.5% yoy through 2022.
Which again brings us back to the key question: what is transitory and can these temporary bursts of inflation transform into something more persistent. BofA advises following these three factors:
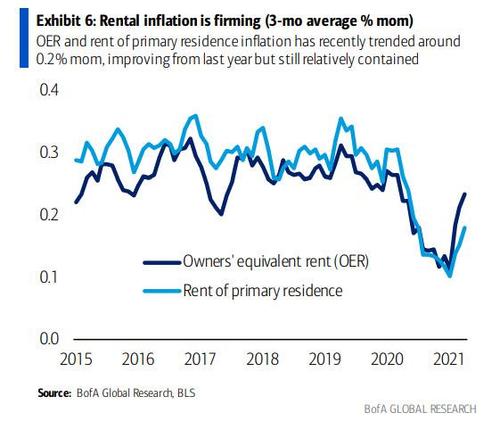
1. Sticky inflation measures: This captures the components of inflation that tend to be less volatile and more a function of the business cycle. The biggest component here is Owners’ Equivalent Rent (OER). OER is running at an average pace of 0.2% mom over the prior three months or 2.8% annualized. So far, relatively contained but starting to move higher relative to the COVID period (and, as Goldman warned last week, it’s about get really hot).
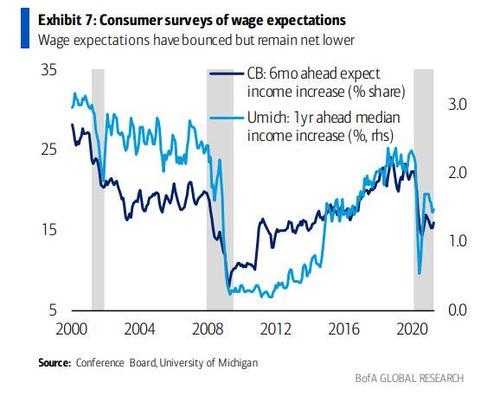
2. Wages: An increase in wages will facilitate greater consumer price pressure. In particular we advise tracking wage growth of the lower income cohort which tends to be more budget constraint and more likely to “pass through” higher wages to consumer goods and services prices. Wage growth has been surprisingly strong, particularly for the lower income population with wage gains for leisure and hospitality and retail trade. And wage expectations have improved, suggesting that workers are becoming more constructive on future bargaining power (Exhibit 7). But again it is unclear if this is transitory due to labor shortages as suggested by the April jobs report.
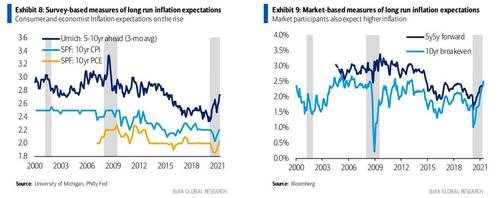
3. Inflation expectations: this is critical as rising expectations will turn temporary inflation into permanent. Repeated price increases have the ability to fuel inflation expectations. We are already seeing measures of inflation expectations move higher in both consumer surveys and market measures. The University of Michigan’s measure of inflation expectations 5-10 years ahead has reached 2.7%, up from the low of 2.2% but still within the range in recent history (May preliminary measure will be released after publication). (Exhibit 8, Exhibit 9)
Out of balance
While it is worth having a discussion how much of the trillions in excess liquidity injected by the Treasury and the Fed have led to today’s skyrocketing prices, we’ll ignore that for now and focus on the current supply/demand dynamics of goods which has caused prices to spike higher should prove transitory, but even BofA admits that “transitory could end up feeling quite long.” Understanding the trends in inventories will help us to gauge the trajectory.
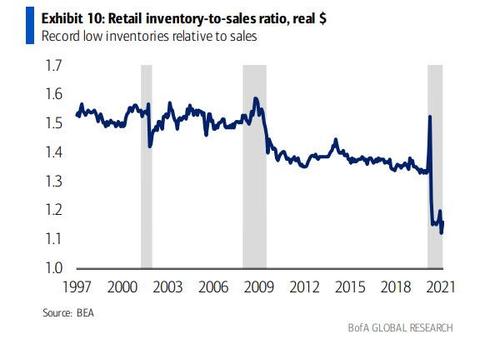
The Bureau of Economic Analysis provides data on real retail inventories to sales (I/S) ratios, albeit with a small lag – the latest data point is February 2021 (Exhibit 10). There was an initial 0.2 pop in the I/S ratio when COVID first hit and the economy was put under lockdown in March and April 2020. However, as the economy reopened in May and June,the I/S ratio reversed sharply by -0.4pp and has since edged lower, achieving a new record low of 1.1 this past January.
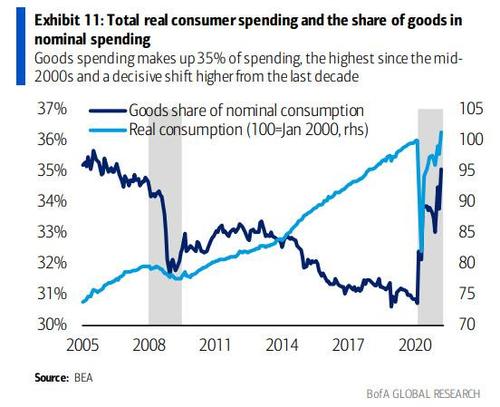
This highlights the nature of this cycle and the rotation towards goods spending. When producers and companies were first faced with the pandemic, they prepared for a period of weak demand by reducing production and trying to work off inventories. But they were quickly surprised by a dramatic rise in demand for goods, particularly durable goods such as autos, household appliances and electronics. The share of consumer dollars spent on goods has soared to 35.1% as of March 2021, the highest in over 15 years, from a low of 30.7%
Also, recall that the level of real consumer spending recently surpassed the pre-COVID peak, by 1.3% as of March. In other words, consumers are actually spending slightly more than what they were before the pandemic with a significantly higher allocation towards goods versus services. This has been nearly 12 months of persistently strong demand for goods.
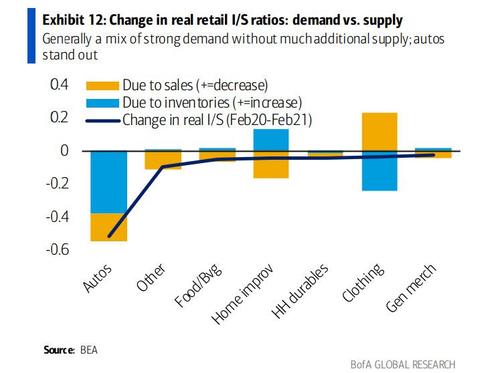
As BofA writes in a recent report, “we can dig a little deeper into the I/S ratios to see where the tightness is most acute. Moreover, we can decompose these I/S ratios into demand vs. supply factors by recalculating the I/S ratios assuming only the change in sales or the change in inventories.” The bank found that autos was the biggest standout by far with the real I/S ratio falling by 0.5pp from Feb 2020 to Feb 2021, which has coincided with the strength seen in auto prices.
The tightening in the real retail auto I/S ratio reflected a combination of strong demand, as evidenced by the -0.2pp contribution from sales, and production falling far behind with an inventory drawdown contributing -0.3pp.
Every other major retail category also saw a drop in their real I/S ratio, but it was overall modest and with varying demand/supply dynamics. In the case of other retailers, food & beverage, household durables, and general merchandise, sales strength was the main driver of the drop in the I/S ratio while retailers generally were able to maintain their inventory levels. Demand at home improvement stores was even stronger and producers actually expanded inventories notably in response, although the former still outweighed the latter on net. On the other end of the spectrum, weak demand at clothing stores led to an increase in the I/S ratio, but retailers actively offloaded their inventories in response.
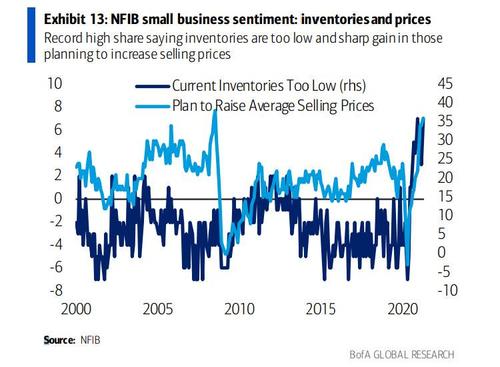
BofA then turned to surveys to gauge the challenges from shortages. According to the National Federal of Independent Business (NFIB), which measures small business sentiment, there are considerable concerns over shortages and price pressure. A record percent of respondents report that inventory is too low while a nearly record of 34% are reporting that they plan to increase prices.
Thanks to Biden’s trillions in pandemic unemployment benefits, labor shortages also remain a challenge which is also holding back production: 54% are reporting few or no qualified applications for job openings, the highest since the end of the last cycle when the economy was in late stages. Similarly, BofA’s own Small Business Owner Report, conducted between March 11 and May 5, found that 25% of respondents reported that the pandemic created a shift in the types of employee roles and skill sets important to their businesses’ success and of those who have tried to hire during the pandemic, 47% reported difficulty finding qualified candidates.
The shortages partly reflect global supply-chain issues. According to BofA, there are two main factors: global container shortage which has led to congestion at the West Coast ports and the semiconductor chip shortage. The former is starting to get resolved, albeit slowly, although shipping container prices continue to rise. But the chip shortage could persist for some time and although the US is trying to increase semiconductor manufacturing capacity, they will remain dependent on Korea and Taiwan for some time.
BofA is confident that the worsening of the supply / demand imbalance may have been the most intense in March given the surge in consumer spending and the combination of events that challenged production, but that’s just speculation. Still, even as consumer demand remains strong we have seen some moderation throughout April and we some of the supply-chain stress has started to ease. Ominously, inventory levels are still incredibly low and it will be a long road ahead to build stockpiles. Sharp price gains could also cool demand which will help reduce some of the pressure. In the end, this all symptomatic of an economy trying to find a new equilibrium.
Transitory can feel like a long time
Just like the data stunned us upon lockdown, the same is happening now with the reopening. With sudden changes in the economy, BofA thinks it will take time to find a new balance in the economy. Very aggressive fiscal and monetary policy has led to a burst in demand upon reopening: based on aggregated Bank of America credit and debit card data, total card spending is running +20% over a 2-year period, more than double the trend prior to COVID (2012-19) of +8% growth over a 2-year basis. With production hampered, this has led to unprecedented shortage of inventories and workers.
The hope is that shortages start to ease as supply catches up to demand. But this won’t happen overnight – in fact even Bank of America thinks “we are many months away from the economy feeling more balanced” yet at some point it will, and after red-hot gains in activity in the summer, economic activity cools in the fall which will also correspond with an increase in the supply of workers following reopening of in-person schooling and expiring UI (unemployment insurance) benefits. This means that the transitory inflation gains are not over.
Tyler Durden
Sun, 05/23/2021 – 10:45![]()
Zero Hedge’s mission is to widen the scope of financial, economic and political information available to the professional investing public, to skeptically examine and, where necessary, attack the flaccid institution that financial journalism has become, to liberate oppressed knowledge, to provide analysis uninhibited by political constraint and to facilitate information’s unending quest for freedom. Visit https://www.zerohedge.com
