How Has Trader Positioning Changed Since The FOMC Meeting
As discussed previously (see “Fed Blinks: Projects 2 Rate Hikes By End Of 2023“, “What The Market’s Shocking Response Means For The Fed’s Endgame“) June’s FOMC meeting was hawkish in several dimensions and yet, after a brief initial shock, the market reaction appears to have been somewhat muted. This has raised the question of how positioning has adjusted ahead and in the aftermath of the FOMC meeting. To answer this question, JPMorgan’s Nick Panigirtzolgou updates some of his regular positioning indicators.
Turning first to bonds, JPM’s quant makes the following observations:
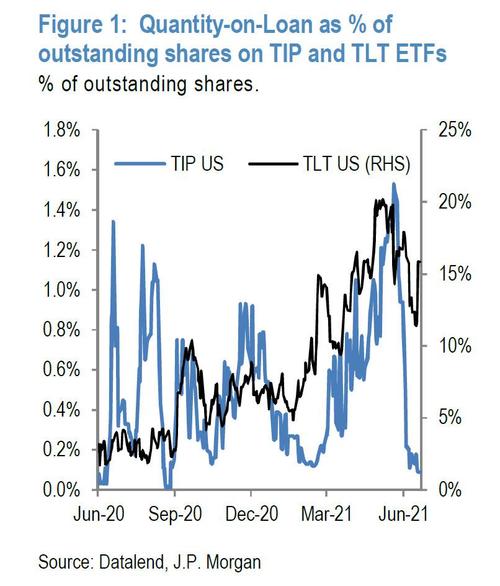
The short base in TIP ETF, proxied by the quantity on loan as a % of outstanding shares, declined sharply around the turn of the month, while short interest in the TLT ETF tracking longer dated nominal bonds declined relatively less and saw a sharp increase in the aftermath of the FOMC meeting.
According to JPM, the effective short interest picture “is one of investors positioning for wider breakevens and this positioning if anything increased further after the FOMC meeting.”
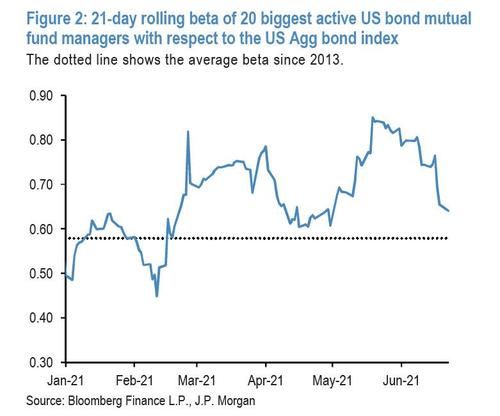
At the same time, US active bond mutual funds, which entered June with elevated betas, “appear to have reduced their duration exposure sharply in the aftermath of the FOMC meeting to levels closer to their longer-term averages. “
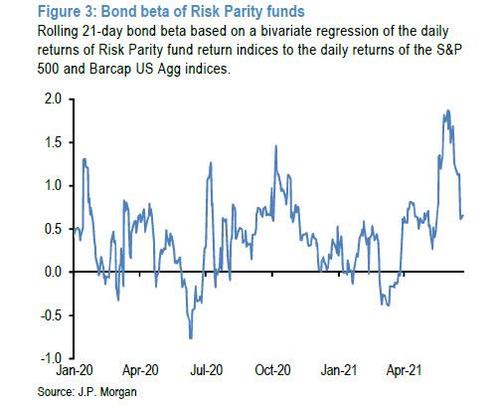
The bond betas of risk parity funds, which were very elevated in early June, had already moderated somewhat heading into the FOMC meeting and declined further after the FOMC meeting following the burst of bond and equity volatility which spooked potential buyers. According to JPM, “the bond beta currently stands around its long-term average, suggesting risk parity funds are largely neutral on duration currently.”
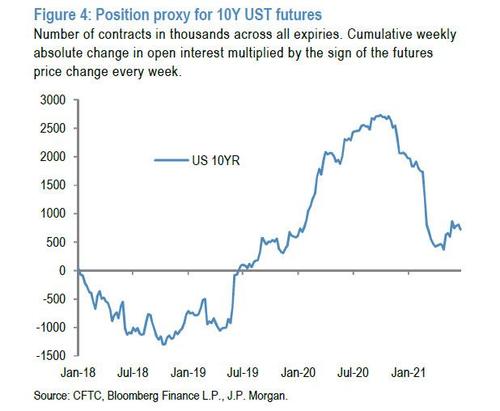
The bank also calculates that based on its estimates, of the previous cumulative addition of duration positions in 10y USTs from early 2019 to October 2020, just over half have since been unwound.
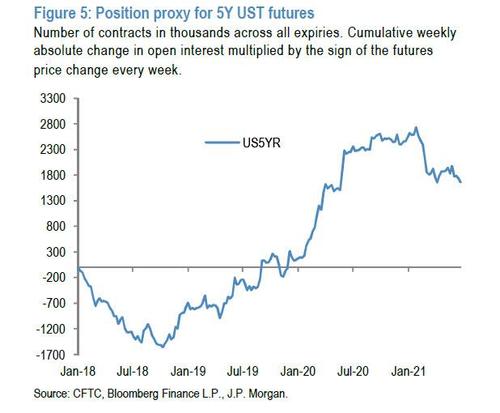
However, at 5y maturities only just over a fifth of the previous cumulative addition of duration exposure from late 2018 to early 2021 has been unwound (as Goldman said in a note last last week “every sell-off in 5s ends up being the opportunity of the year”).
And since there appears to have been relatively little change in the aftermath of the FOMC meeting, JPM notes that “there is still plenty of room for investors to add shorts before positions approach their late 2018 levels.”
Next, looking at momentum-based signals that JPM uses to proxy for positons by momentum-based investors such as CTAs suggest that they were modestly long 10y UST duration and turned largely neutral after the FOMC…
… while also adding to modest shorts in 5y. However, positions in both are relatively modest, suggesting CTAs could amplify volatility in either
direction from here.
What about other asset classes? Here JPM makes the following observations:
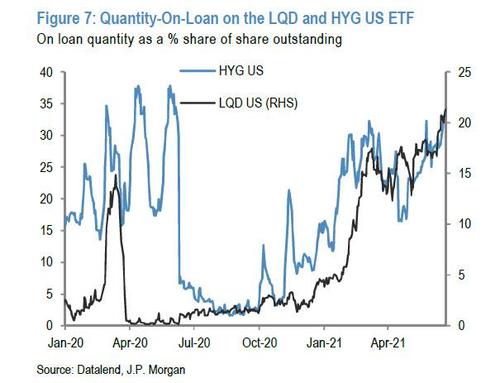
In credit, the short interest on the LQD and HYG ETFs, the largest US HG and HY ETFs, respectively, again proxied by the quantity-on-loan as a % of outstanding shares, were already sitting at elevated levels heading into the FOMC meeting.
Since the meeting, their short interest rose further suggesting elevated concerns among credit investors.
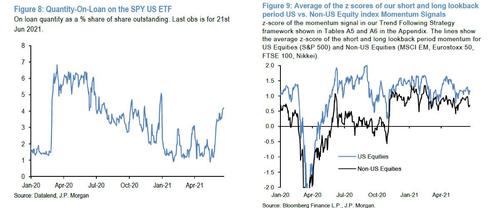
Next, JPM looks at equities, where the short interest in the SPY ETF has increased markedly, suggesting investors have been adding equity downside protection. And while momentum signals for US and non-US equities remain long, they have declined from their elevated levels earlier in the year.
The momentum signals for US equities in particular were still at extreme levels, i.e. with a z-score above 1.5, in early April, and now stand at around 1.1. In other words, equity positions by momentum traders look less stretched.
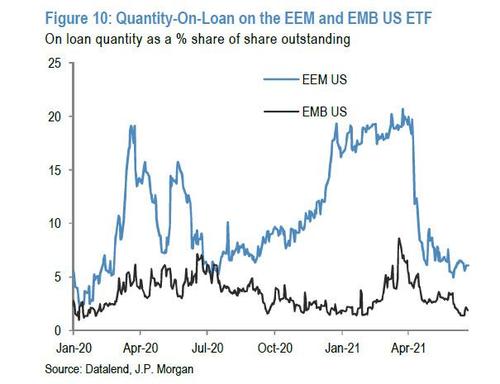
Elsewhere, short interest in both the EEM and EMB ETFs has if anything continued to decline (Figure 10), showing little appetite by investors to hedge EM exposures. This could suggest global investors’ EM exposures are relatively modest.
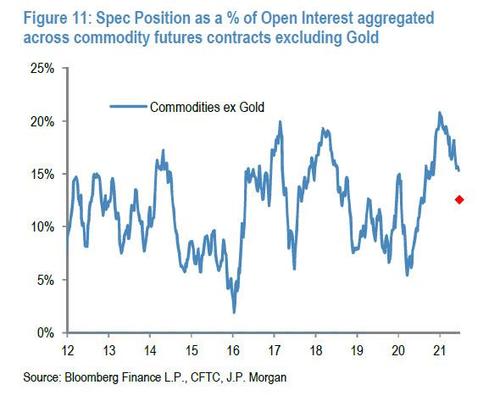
Next, looking at commodity positions, JPM finds bullish sentiment has declined sharply: Figure 11 shows the net speculative long positions in commodity futures excluding gold from CFTC data, and shows a marked unwind in net longs. The red diamond shows a proxy for the position adjustment to the most recent days (based on the absolute change in open interest multiplied by the price change) suggesting net longs were further unwound after the FOMC meeting. This means elevated net longs that JPM had previously ssaid were a near term positioning headwind for commodities appears to have dissipated to a large extent.
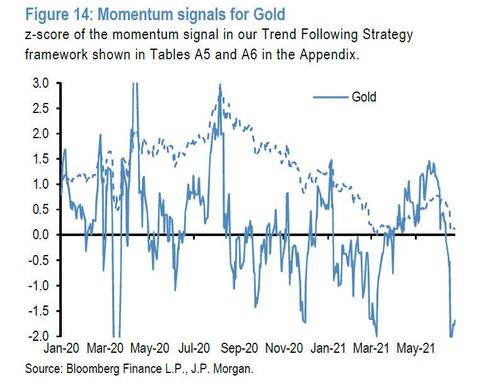
At the same time, JPM’s momentum signal for gold suggests CTAs have turned quite bearish…
… and the magnitude of the z-score is approaching extremes seen in March 2020 and 2021, which to JPM suggest “there is a high risk that mean reversion or profit taking signals could kick in.” And since JPM prop has a habit of taking the other side of its public positions, what will most likely happen is another short squeeze sending gold sharply higher in the coming days.
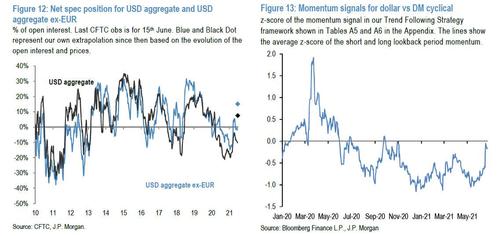
Finally, looking at FX and the all-important dollar, net spec positions have also adjusted significantly, and after starting the year with net shorts at a level last seen in 2013, these aggregate USD net shorts have largely unwound and turned close to neutral. JPM’s positioning proxy has turned modestly long USD after the FOMC meeting. Similarly, the bank’s momentum signals suggest net dollar shorts by CTAs were effectively closed after last week’s FOMC meeting.
However, as JPM concludes, “neither the net spec positions nor our momentum signals suggest bullish dollar positions are starting to form a headwind for further dollar gains at this point, however.”
Tyler Durden
Sun, 06/27/2021 – 21:40![]()
Zero Hedge’s mission is to widen the scope of financial, economic and political information available to the professional investing public, to skeptically examine and, where necessary, attack the flaccid institution that financial journalism has become, to liberate oppressed knowledge, to provide analysis uninhibited by political constraint and to facilitate information’s unending quest for freedom. Visit https://www.zerohedge.com

