How We Would Pay For The War
By Michael Every, Hugo Erken, Michiel van der Veen, Ryan Fitzmaurice and Stefan Voge of Rabobank
Summary
- Fears of a Russian invasion of Ukraine linger despite recent possible de-escalation
- We build on our recent ‘Ukraine metacrisis’ to model three macroeconomic war scenarios
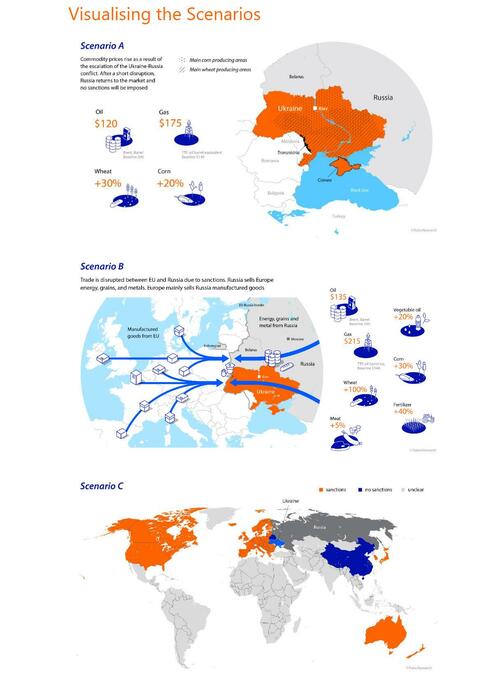
- Scenario A assumes a short disruptive war; scenario B a war and effective sanctions on Russia; and scenario C a war, effective sanctions on Russia, and secondary sanctions on others still trading with Russia
- In scenario A, some economic pain is clear; in B, severe in places; in C, so bad as to be paradigmatic (and unquantifiable with a traditional macro model)
- Worryingly, we also see a high risk/reward scenario for Russia rather than just downside, which argues for scenario B (risking C), not A, to play out – or for a more violent world order
- Keynes argued “How to Pay for the War”: we would all pay for this war if we have it, but how much and by whom varies
“A reluctance to face the full magnitude of our task and overcome it is a coward’s part. Yet the nation is not in this mood and only asks to be told what is necessary. It is a fool’s part too. For victory may depend on our making it evident, that we can so organize our economic strength as to maintain indefinitely the excommunication of an unrepentant enemy from the commerce and society of the world.” – J. M. Keynes, “How to Pay for the War” (1940
How We’d Pay For the War…Depends on the War
Contrary to the public claims of US intelligence, Wednesday 16 February 2022 did not see a Russian invasion of Ukraine. Yet despite promises from Russian President Putin to withdraw some troops, the situation remains extremely tense: US sources indicate Russian forces are now actually closer to the Ukrainian border and could still advance at any time. Moreover, the broader geostrategic backdrop between Russia and Ukraine described in detail here is not one that can be easily or quickly resolved.
This report, which builds on our previous ‘Ukraine metacrisis’ analysis, does not assert the probability of any geopolitical outcome: it attempts to assess the global macroeconomic impact if an invasion of Ukraine were to occur. We see three broad war scenarios: in one, the economic pain is notable but bearable; in another it is severe in places; in another, it is so bad as to be paradigmatic.
As will be shown, we would all pay for the war one way or another – although how much and where varies. We actually quantify this in per capita contributions relative to a no war base case.
Three War Scenarios
Let’s begin by defining the parameters of the three scenarios we project. Economic forecasting is a hazardous exercise with a poor track record – and far more so given a backdrop of binary-outcome geopolitical decisions with very fat tails. Indeed, it is impossible to capture all possible outcomes vis-à-vis Ukraine. This report simply assumes a short war occurs and Russia wins. From there, we see only three realistic scenarios to test in terms of their macroeconomic impact:
From here, we now need to clarify the various assumptions we make for key markets as inputs to our macro modelling – although the specific price-points for some commodities are obviously of interest themselves. We will start with scenarios A and B, before going on to scenario C separately.
Assumption 1: Global Trade Flows
Scenario A, war, disrupts global trade for a maximum of six months. We assume significant drops in EU-Russia trade flows in particular.
Scenario B, war and effective sanctions, assumes the same, and that sanctions are imposed on Russia, occupied Ukraine, and Belarus by the US, EU, Australia, New Zealand, Japan, and Korea, altering global trade patterns. Yet some countries will try to evade such sanctions: China has stated it will work with Russia to do so. We therefore assume that $100bn in commodity trade previously seen between sanctioning countries and Russia is rerouted to China at a discount while other countries pay higher prices.
In scenario C, we assume the West also imposes effective secondary sanctions on China and other non-compliant economies.
Assumption 2: Risk Premia
War would result in global financial market turmoil, and war fears have already seen global equities pressured lower: indeed, Bloomberg recently noted a call that a Ukraine war could be a “polar vortex” for markets. To gauge this shift, we raise the investment premium in our model scenarios to reflect wider spreads between risk-free interest rates and the return on risky assets.
In scenario A, war, we adopt a relatively small overall rise in the global investment risk premium, comparable to the rise seen after the annexation of Crimea in 2014.
In scenario B, war and effective sanctions, we increase the global investment risk premium to match the increase seen during the second Gulf War in 2003.
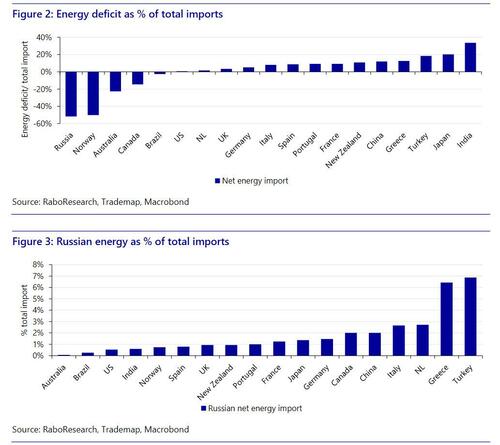
However, not all countries would be hit equally. To simplify which would and how much, we focus on the direct macroeconomic impact of energy prices as a standardized measure. The extent to which the risk premium is raised per country then depends on its exposure to Russian energy imports. Methodologically:
- Net energy exporters are left out of the equation, as they are seen as better insulated;
- We then look at the share of energy imports within total imports;
- We then look at the share of Russian energy imports within energy imports.
Of course, there can be other financial risk transmission mechanisms, such as interest rates — where central banks already face inflation/growth dilemmas– and a loss of ‘animal spirits’. However, we believe this energy metric speaks best to the most powerful, immediate economic and financial shock that would be delivered globally.
Assumption 3: Oil and Natural Gas Prices
There is a long and storied history of geopolitics and supply disruptions impacting oil and gas prices. A Ukraine war has the potential to be a major market-mover given Russia’s dominant position as a global energy supplier.
Crude oil and refined products
Russia is one of the world’s top three producers of crude oil, alongside the US and Saudi Arabia. Russia currently produces over 10mb/d (10% of global production) and exports roughly half of that to large consumers globally. Furthermore, Russia is also a meaningful exporter of refined products, such as diesel and gasoline. Importantly, nearly half of Russian crude oil exports (~2.4mb) are sent to Europe via a major long haul and cost-effective pipeline network that stretches from the oil fields of Western Siberia all the way to Germany with important arteries along the way, giving Russia a significant financial edge over competing waterborne imports. This competitive advantage has led to Russia gaining a strong foothold in Europe with a nearly 30% market share of its oil imports and increased geopolitical leverage over its European customers as a result. This dynamic has been on full display recently, with one high ranking Russian official threatening to cut off energy supplies to Europe should Russia be banned from using the SWIFT system in the event of Western sanctions. We therefore consider scenarios whereby Russian energy exports to Europe are (partly) cut-off and re-routed to Asia.
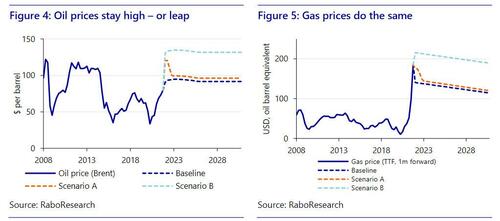
Scenario A, war, would result in Brent spiking as hoarding, increased transit costs, and the geopolitical risk premium spikes. The last major oil supply disruption to Europe was during the 2011 Libyan civil war, when its oil exports collapsed due to infighting: as Libyan oil production fell from 1.5mb/d to zero, Brent prices spiked from $90 to more than $125 over four months.
Scenario B, war and effective sanctions, would see oil at $135 and higher for far longer.
Natural gas
The situation is even more dire in relation to natural gas given Europe and Asia are already feeling a supply crunch that has sent prices soaring above $200 per barrel of oil equivalent: the push to decarbonize global economies has resulted in robust natural gas demand growth in Asia, forcing Europe into bidding wars for tight supplies of the clean burning fuel.
Russia is a dominant global producer of natural gas and Europe is even more dependent on it for supplies than it is for oil, with Russia controlling 35% of the market. There is no saying how high natural gas prices could go in the event of a supply disruption given how high prices already are relative to history, but in scenario A we assume $175 per barrel of oil equivalent and in scenario B $215, and for far longer. The one saving grace would be that we are approaching the end of the high-demand winter months, allowing the market a few months to adjust.
Assumption 4: Food Prices
War would have a major impact on grains, vegetable oils, and fertilizers.
Grains
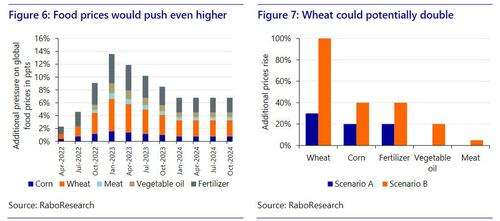
Scenario A, war, would stop Ukrainian wheat, barley, and corn exports. With very tight global markets, this would drive prices up even if 2/3 of the season’s wheat and barley and 1/3 of the corn crop has already been exported. We expect a 30% rise in wheat and 20% in corn prices. Scenario B, war and effective sanctions, would be worse. Russian wheat and barley have also been 2/3 exported this season, but Russia and Ukraine account for 30% of world wheat exports, which would drive global prices up 30% if removed. If sanctions were still in place by July, when harvesting of the next crop begins, it would cut deeply into global grain availability. Demand rationing would be forced via higher prices: wheat would then double, and corn rise 30%. By autumn 2022, northern hemisphere farmers (where most wheat is grown) could extend their wheat area by cutting back on other crops, especially feed grains; but only by mid-2023, when those crops are harvested, could the wheat market somewhat rebalance.
Feed grain prices depend on China’s trade with Russia. China imports massive amounts of feed grains (corn, barley, sorghum) from world markets: it can buy these volumes almost exclusively from Russia/Ukraine. China could also buy more Russian/Ukrainian wheat for animal feed to replace global corn/barley, while global buyers could buy from origins previously serving China’s needs. In such a scenario, the impact on corn/barley would be relatively small. However, if China cannot buy from Russia/Ukraine, harvested volumes in Russia have to go into storage, and China buying from world markets would see a further global shortage, driving prices up, albeit not as much as for wheat. We project corn and barley to rise 30% in scenario B.
Vegetable oil
Global vegetable oils markets are also very tight, and while sunflower oil is not massive in the global context, Russia and Ukraine still account for 15% of total global vegetable oil exports. Key buyers from the region are China and India, again leaving the question whether China can import from there or not. If China can’t import, global markets will have to cut demand via significantly rising prices. We assume a 20% rise in vegetable oil prices in scenario B.
Fertilizers
While prices are currently very high, a further increase cannot be avoided if key exports from Russia/Belarus are disrupted. As natural gas is a key price driver for fertilizer production, world producers would also transfer higher input costs to their finished fertilizer product, driving prices up further. We assume fertilizer prices rising 20% in scenario A and 40% in scenario B. However, China would again be insulated in scenario B if it can trade with Russia.
Unquantifiable Scenario C
Scenario C means war, the West imposing effective sanctions on Belarus/Russia, and then effective secondary sanctions on China other economies that deal with Russia.
Crucially, this would have such a disruptive effect on global trade flows that macroeconomic models cannot capture it: no model of the globalised international economy today can describe its political-economy bifurcation closer towards that which prevailed during the Cold War. However, we can describe it qualitatively. As a contemporary example of this isolation, look at the economic disruption being experienced by Iran; of the US-China trade war; the supply-chain impact of Covid; the border headaches caused by Brexit; or the sudden loss of Chinese export markets experienced by Australian wine producers. A combination of all of these would result from Western sanctions dividing the world into countries ‘with us or against us’ (which is how a former US administration categorised its own military action against Iraq two decades ago).
Markets are unprepared for such outcomes – as they were for Brexit, the US-China trade war, and Covid, etc. As such, some European economies are nervous about being too tough on Russia, and even the present US administration is cautious about how far it can realistically go in imposing sanctions that others will comply with globally.
However, as we argued in ‘The Ukraine Metacrisis’, the absence of effective secondary sanctions would itself carry a worrying message in terms of the West’s inability to compel Russia not to resort to war via primary sanctions. (An issue we will return to later.)
Commodity price shock using NiGEM
To calculate the impact of a commodity price shock resulting from war we used the macroeconometric trade model, ‘NiGEM’. Rabobank has been using this econometric model for over a decade, and other institutions, such as the ECB and the Bank of England, use the model as well. In this respect the outcome of our exercise are informative, in that they show what policy makers may be assuming lies ahead ‘geopolitically’.
The upside of NiGEM is that all relevant variables –commodity prices, trade variables, risk premia– can be adjusted to simulate a potential war and at the same time take into account country-specific interdependencies through trade, competition, financial markets and international asset stocks. However, NiGEM estimates in a ‘New-Keynesian’ framework, and its rigidities result in a slow adjustment process in case of external shocks. We forced adjustments onto the model to account for unorthodox parameters presented by scenario B. The commodity price shocks we use effect countries through a number of mechanisms.
- First, trade between countries is impacted. NiGEM treats export and import prices as a weighted average of non-commodity and commodity prices, the latter encompassing oil, food, beverage, agricultural raw materials, and metals prices.
- Second, higher food and energy prices result in consumer price inflation, which erodes disposable income, purchasing power and, consequently, lowers private consumption and GDP growth.
- Finally, a rise in energy prices affects potential output negatively, as this depends on the energy intensity (i.e. oil, gas, coal, renewables) of a country.
A downside of NiGEM is that the second-round effects of higher commodity prices on producer prices and, consequently, the feed-through in business investments and consumer prices is modelled rather weakly. NiGEM also cannot handle the extreme scenario C.
Visualizing the Scenarios
Having drawn our two quantifiable scenarios A and B, and our key assumptions for inputs, the model’s results can now be described in turn.
The Macroeconomic Impact
Inflation
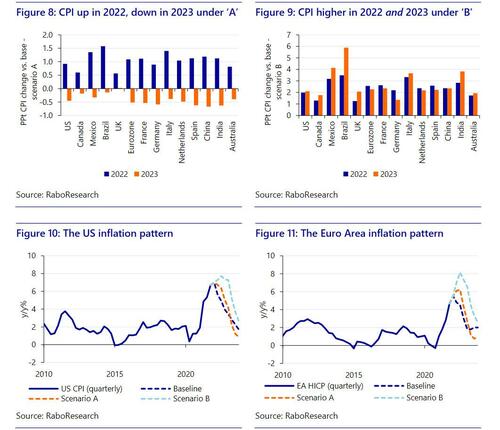
Scenario A, war, would see a significant upward revision to y/y CPI inflation in 2022, ranging from 0.6 – 1.6ppts, and then flat to -0.7ppts downward revisions in 2023. This would once have been considered a major inflation shock – but against the present backdrop look mild or a continuation of the recent trend, which speaks to the scale of present inflation pressures.
Scenario B, war and effective sanctions, would see upward revisions to y/y CPI inflation in 2022, ranging from 1.3 – to 3.5ppts, and then a further 1.4 – 5.9ppts in 2023. That is a major continuation of our current inflation shock. Indeed, the overall picture (underlined for the US and Europe in Figures 10 and 11) is that war would ensure what was wrongly described as “transitory” inflation by central banks remains high in 2022; and war and sanctions would mean it remains high in 2022 and 2023. After that, the dynamic reverts back to the vicissitudes of helpful base effects, unhelpful supply chains, uncertain labor markets, and unwelcome fiscal and monetary policy.
(On which note, partially related to inflation, a potential influx of Ukrainian refugees into the EU could distort supply-demand and labor market dynamics dramatically: some fear millions may try to enter.)
Meanwhile, the impact on poorer economies –particularly of higher food prices– could prove socio-economically destabilizing. Even in developed economies, where food is a far smaller share of consumption baskets, it could increase pressures for higher nominal wage growth that are already building, and/or fuel political populism. This raises the tail risks for more inflationary pressures building further out, but this is a political economy forecast and not an economic one.
GDP Growth
Scenario A, war, sees lower private consumption and investment and so downwards revisions to 2022 and 2023 GDP growth relative to our base scenario. In the dollar-bloc these effects are moderate, with the US seeing growth 0.2ppts lower in 2022 and essentially unchanged in 2023. In Europe, the impact is heavier. Eurozone growth is 0.3ppts lower in both 2022 and 2023. The UK sees 2022 and 2023 growth 0.2ppts lower. In EM, India sees growth 0.7ppts lower in both years due to its higher trend GDP growth rate, while China sees a drag of -0.5ppts for the same reason. Mexico and Brazil are relatively unaffected. Russia’s result will be discussed separately ahead.
Scenario B, war and effective sanctions, is more dramatic. US growth is 0.4ppts and 0.6ppts lower in 2022 and 2023, and the rest of the dollar bloc see growth 0.2-0.3ppts lower in 2022 and 0.2-0.6ppts lower in 2023, New Zealand hit hardest. Eurozone GDP growth is 0.6ppts lower in 2022 and 1.1ppts in 2023, where headline GDP growth is just 1.1% y/y. The Netherlands sees 2022 growth 0.9ppts lower and 2023 -1.1ppts, with headline growth of only 0.4% y/y. Italy is hit hardest in 2023, with growth 1.5ppts lower and GDP growth of only 0.2% y/y. Germany sees GDP growth 0.8-1.1ppts lower over the period. Outside the EU, UK growth is 0.4-0.7ppts lower. In EM, Indian GDP is 1.1-1.2ppts lower, China’s 0.7-1.2ppts lower, Mexico’s slightly lower in both years, and Brazil’s 0.1ppt lower in 2022 but 0.3ppts higher in 2023.
Obviously, these are just illustrative scenarios rather than point forecasts: we are fully cognizant of the “known” *and* “unknown unknowns” involved in economic forecasts of an even more dynamic and non-linear geopolitical global economy than usual. Nevertheless, one can see that war would prove painful, but manageable to most countries, yet hitting Europe hardest, while war and effective sanctions would hit harder, and parts of Europe very hard indeed. Regardless, we still do not see outright recession risks – and that is even before we assume how central banks and/or governments may respond with supportive monetary and/or fiscal policy.
“What Did You Pay in the War, Daddy?”
We must remember it is the Ukrainian people who would pay the physical, psychological, and economic price of a war. However, other countries’ politicians have to worry about both their principles and their economies – and this has implications for the strategy taken to try to prevent war, as shall be shown. It is therefore necessary to quantify how much other states would ‘pay’.
We measure this in terms of how much lower per capita GDP growth (in constant US dollars at purchasing power parity, PPP) would be in scenarios A and B relative to if a war had not happened. Of course, citizens do not ‘earn’ all GDP, just the labour share: we include the capital share to illustrate the negative impact of war.
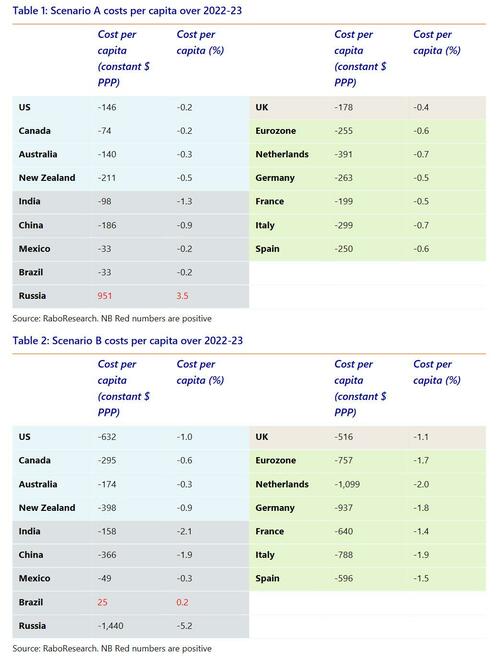
Scenario A, war, (Table 1) sees ‘lost’ GDP per capita over 2022-23 relative to our base case as marked – though this not a direct loss from actual 2021 GDP per capita levels, but rather a missed opportunity. We see a range from -$33 in Brazil and Mexico to +$951 in Russia – that latter figure in particular has implications we will discuss shortly.
To equalise these dollar figures between economies of very different sizes we look at the % change in GDP per capita relative to the base case. Here we see an American would be 0.2% worse off than if the war had not happened, mostly due to higher inflation. In dollar bloc countries the figures range from -0.2 to -0.5%; in emerging markets from -1.2% (India) to a surplus of 3.5% (Russia); in the UK -0.4%; and in Europe it runs from -0.5% to -0.7%, with the Eurozone at -0.6%.
Scenario B, war with effective sanctions, (Table 2) sees the lost opportunity relative to our base case far higher. We see a range from +$25 in Brazil to a huge -$1,440 in Russia – that latter figure again has serious implications. In GDP per capita terms, the dollar bloc has a -0.3% to -0.9% range; emerging markets run from +0.2% in Brazil to that huge Russian loss of 5.2%, while China sees -1.9%; the UK is -1.1%; and Europe is hit extremely hard, with -2.0% in the Netherlands. Again we stress that this is not a decline in nominal dollars from the 2021 level, but a missed opportunity measured in constant dollars at PPP. Think of it as money left on the table.
Wealth Effects
Obviously, a war, effective sanctions, higher inflation, and lower growth would all hit asset prices: global equity markets have already seen risk-off moves over Ukraine war fears. We opted not to try to impute any such negative wealth effects on top of the macro model we used: this was partly because we already had enough “unknown unknowns” to try to capture, and partly because it involved forecasting asset prices as well as macro variables. Instead, we make the simpler point that:
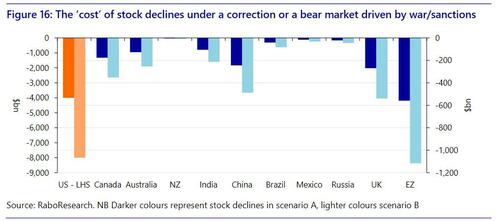
Scenario A, war, suggests risks of an equity market correction, a 10% decline from present levels assuming this is not yet fully priced in (which we believe is the case).
Scenario B, war and effective sanctions, suggests risks of an equity bear market, a 20% decline from present levels, assuming this is not yet fully priced in (which we believe is the case)
As can be seen (Figure 16), the combined decline in stock values in either a correction or a bear market runs into trillions of dollars, led by the huge US market. To many, that makes the possibility of war even more worrying than the projected impact on GDP would suggest.
Worryingly, however, this fear can create perverse incentives that can actually escalate economic and geopolitical risk scenarios. We will now explain why.
High Risk/Reward for Russia: and the World!
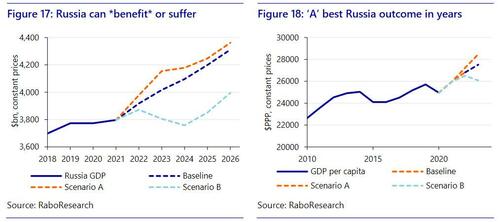
Scenario A, war, shows the Russian economy actually *benefits*. Shockingly, our model shows the average Russian would be $951 better off (in constant PPP dollars) if they win the war, and this is not including control of Ukraine’s fertile farmlands, or unquantifiable psychological, geopolitical, or geostrategic benefits. It may be uncomfortable, but that is the result of higher commodity prices for an economy that is so exposed to such commodities.
Scenario B, war and effective sanctions, however, would force Russian GDP per capita down a massive 5.2%, or $1,440. On one level, the risk/reward is clearly slanted towards Russia not acting,… if economics is a guide to geopolitical behaviour. Yet only if we see *effective* sanctions! Yet these may prove hard to achieve.
We already showed scenario B would be more inflationary and depress GDP growth for longer, and the impact would be felt by those imposing sanctions as well as Russia. This means some countries may wish to avoid sanctions – leading to scenario A; and if ineffective sanctions were imposed, it again leads to scenario A. If sanctions are effective, evaders would then profit most, incentivising non-compliance; yet extending sanctions to the evaders then leads to scenario C’s huge macroeconomic, financial, and geopolitical tail risks; and not extending sanctions can render them ineffective and lead back to scenario A!
In short, there appears no middle or ‘muddle’ way. Geostrategic logic, and the economic outcome shown above, suggests risks we either lean towards a world that rewards geopolitical aggression (scenario A), or towards a more bifurcated global economy to try to stop it (scenario C). Either outcome promises unpleasant future macroeconomic shocks, even if they cannot be quantified in traditional macro models.
Whose part is which scenario
Although we must stress that NATO will not go to war directly with Russia, and so this is not WW3 we are discussing, the logical argument to embrace the more painful economic scenario B (and then risking C) to prevent the most painful geopolitical outcome (scenario A) means we must end this report as we began it – with what Keynes wrote about paying for WW2 in 1940: “A reluctance to face the full magnitude of our task and overcome it is a coward’s part. Yet the nation is not in this mood and only asks to be told what is necessary.”
But what mood are the nations in? As just shown, we would all pay for the war. How much we do pay depends on if the West again thinks “victory may depend on our making it evident, that we can so organise our economic strength as to maintain indefinitely the excommunication of an unrepentant enemy from the commerce and society of the world”; or if it instead opts to reduce near-term costs even at the risk of paying a far higher price in more than just economic dimensions at a later date.
Tyler Durden
Sun, 02/20/2022 – 20:35
Zero Hedge’s mission is to widen the scope of financial, economic and political information available to the professional investing public, to skeptically examine and, where necessary, attack the flaccid institution that financial journalism has become, to liberate oppressed knowledge, to provide analysis uninhibited by political constraint and to facilitate information’s unending quest for freedom. Visit https://www.zerohedge.com


