Shippers Are Back In The Driver’s Seat On Rates
By Michael Rudolph of FreightWaves.com
This past week marked the first interruption of consecutive declines in the Outbound Tender Volume Index (OTVI) since early March.
It is still too early to dance around the maypole, however, as this bounce has not yet erased the significant contraction seen in freight demand.
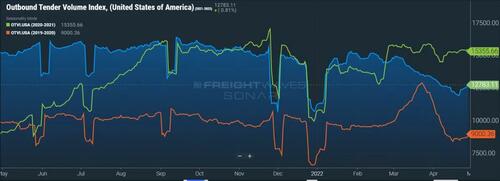
Though OTVI climbed 6.6% over the past week, it faced easy comps as volumes were depressed in the week following Easter Sunday. On a year-over-year (y/y) basis, OTVI is down 16.75%. Comparisons on a y/y basis can be thorny because OTVI can be inflated by an uptick in tender rejections. At this time last year, OTVI was greatly inflated by rising tender rejections, whereas rejection rates have since nosedived to incredible lows.
Looking at accepted tender volumes, which is OTVI adjusted by the Outbound Tender Reject Index (OTRI), we see growth of only 0.3% y/y as well as growth by 8.3% on week-over-week (w/w) basis — the latter w/w growth, again, came against easy comps. The y/y picture for accepted volume may not appear grim, but the overall freight market is historically strong during the run-up to summer. The current limping state of the market, on the other hand, should concern carriers.
The Chinese government appears to be gearing up for extended COVID lockdowns in Shanghai and, given recent school closings, possibly Beijing. The Port of Shanghai is the busiest container port in the world; any disruptions to its operations would have severe ripple effects on global supply chains. At first glance, the Port of Shanghai does not seem to be majorly impacted by the ongoing lockdowns — average dwell times for exports are currently at a little more than two days, well below the average of three days over the past year.
Part of these low dwell times can be explained by the lack of goods flowing into the port, as productivity at manufacturing plants and the movement of truck drivers are both heavily restricted by the lockdowns. There is a likely accumulation of goods that are languishing in nearby warehouses or that have yet to be produced by factories in Shanghai. This accumulation is a ticking time bomb: Once it is able to be delivered to the terminals, the port will be inundated with excess cargo and will then be unable to operate efficiently.
Another cause for concern will be the limited supply of empty containers caused by restricted freight flow at Chinese ports. Shipments from China to Europe are already being delayed, inhibiting the gross number of containers that can be delivered, unloaded and, in turn, reloaded and shipped to the United States. Any curb on trade between Europe and the U.S. is a mixed blessing. On the one hand, a reduction in new vessel arrivals will allow East Coast seaports to tackle the backlog of cargo that is currently congesting them. On the other, this reduction could kick the can further down the line, as exporters on the East Coast would eventually have a limited supply of empty containers themselves. Whatever the case, the lockdowns in China are threatening to extend well into the summer.
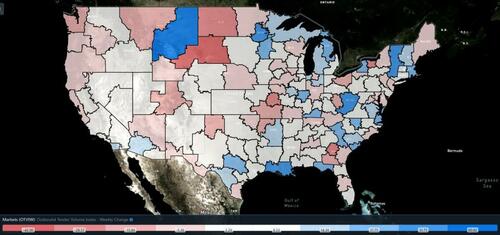
Of the 135 total markets, 100 reported weekly increases after volumes recovered from the Easter lull.
Since last week was quite barren, freight demand this week faced favorable comps on a w/w basis. Volumes returned to the ports: Charleston, South Carolina, was up 23.4%; Los Angeles was up 7.77%; and Houston was up 4.96%. Volumes also returned to the largest markets: Atlanta was up 10.2%; Ontario, California, was up 6.63%; and Harrisburg, Pennsylvania, was up 6.41%.
There were, however, a few markets to which this bounty of freight volume was not extended. Lakeland, Florida — the state’s largest market by outbound volume — was the only market in the state to experience contraction this week, with volumes falling nearly 2% w/w. The Indianapolis market, a Midwestern hub for manufacturing, saw volumes decline 2.14% w/w after a recent survey expressed Hoosier manufacturers’ concerns about their ability to overcome supply chain disruptions and to contend with the rising costs of material inputs.
By mode: Reefer volume took a tumble this week as the Reefer Outbound Tender Volume Index (ROTVI) fell 6.7% w/w. Lakeland, Florida — the nation’s largest outbound market for reefer freight — saw its own ROTVI decline 3.1% w/w after a sharp rise and fall early in the week. Dry van volumes, however, bounced back and the Van Outbound Tender Volume Index (VOTVI) rose 6.9% w/w accordingly. In produce-heavy markets, such as those in the Southeast, reefer volumes should be sustained by seasonal patterns — after all, demand for food is fairly inelastic.
Tender rejections finally fall to sub-10% levels and show no signs of slowing
Although treading water above 10% at the beginning of the week, OTRI quickly fell into single-digit percentages before the week’s end. Excepting the onset of the 2020 pandemic, OTRI’s current trend marks both the steepest and longest decline in a non-holiday-affected period.
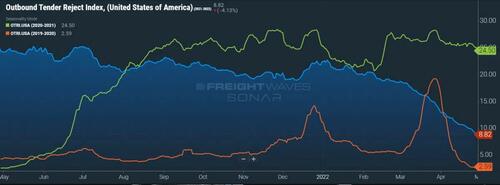
Over the past week, OTRI, which measures relative capacity in the market, fell to 8.82%, a change of 138 basis points (bps) from the week prior. OTRI is now 1,634 bps below year-ago levels as it is decidedly established in single-digit percentages.
One of the biggest pressures facing carriers is the uninterrupted rise of diesel prices. Carriers playing primarily within the spot market already are exposed to volatile rate swings and reduced demand for spot freight, but to make matters worse, they typically have to eat the cost of fuel as part of their all-in rate. Yet even carriers running contracted loads still face the pressure of diesel hikes, since they normally pay for fuel at the point of sale while fuel surcharges can take months to reimburse them. That period of waiting for reimbursement can be crucial, since other monthly costs cannot be deferred so easily: insurance expenses, maintenance costs and, if the carrier’s equipment is not paid off, debt servicing.
Larger carriers often buy fuel at discount, wholesale prices and then charge elevated retail prices for their surcharges, but the trucking industry as a whole is dominated by smaller carriers. As of February 2021, of all the carriers registered with the FMCSA, a mere 2.6% operated fleets with 20 or more trucking units. Almost 92% had fleets of six or fewer trucks. So, while larger carriers might experience some insularity from diesel price hikes, the truckload market is altogether exposed to these fluctuations.
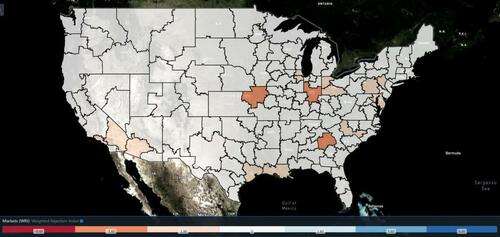
The map above shows the Weighted Rejection Index (WRI), the product of the Outbound Tender Reject Index — Weekly Change and Outbound Tender Market Share, as a way to prioritize rejection rate changes. As capacity is finding freight, there are currently no blue markets that would normally be objects of attention.
Of the 135 markets, only 24 reported higher rejection rates over the past week as carriers compete for loads amid quieter freight demand.
By and large, capacity came back online during this week with only a few notable exceptions. As volume surged through the East Coast seaports, rejection rates rose as capacity did not meet demand. After a dramatic fall in tender rejections the week prior, Savannah, Georgia, saw rejections rebound by 159 bps to 6.73%. Similarly, the market of Charleston posted a rejection rate of 7.08% this week, up 82 bps from the previous week. These two markets host two of the fastest-growing container ports in the U.S., since they are increasingly an attractive alternative to congested seaports in Southern California.
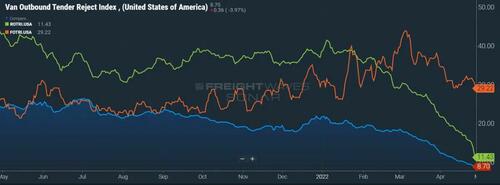
By mode: Despite falling 315 bps this past week, the Flatbed Outbound Tender Reject Index (FOTRI) shows clearer demand for flatbeds than its dry van and reefer counterparts. FOTRI currently sits at 29.22%, 304 bps higher on a y/y basis. In Illinois (and probably elsewhere), it was commonly joked that there were two seasons: winter and construction. Construction season is already well underway, with new residential and nonresidential construction heating up to levels not seen since 2006. Moreover, high crude prices are driving investment into oil drilling. Accordingly, flatbeds will be in great demand for the foreseeable future.
Rejection rates in the other two modes, dry van and reefer, have continued along a protracted decline that began in early March. The Van Outbound Tender Reject Index (VOTRI) is now at 8.7%, 124 bps lower on a w/w basis and 1,642 bps lower y/y. Following the trend in ROTVI, the Reefer Outbound Tender Reject Index (ROTRI) is down 479 bps this week to 11.43%, a whopping 3,307 bps below year-ago levels.
Contract rates show signs of following spot rate trend, declining rapidly w/w
The spot rate data available in SONAR from Truckstop.com is updated every Tuesday with the previous week’s data.

The bottom has yet to be found on dry van spot rates. To borrow yet another analogy from roller coasters, any carrier wearing a waterproof poncho is painfully dry as it waits for the Splash at the end of the Mountain. Truckstop.com’s national all-in dry van spot rate, which is based on the top 100 lanes from Truckstop.com’s load board, fell 8 cents per mile this week to $2.94 per mile, including fuel surcharges and other accessorials.
This week marks the first time that the rate has fallen below $3 a mile since February 2021. For context, the national rate averaged around $2.10 a mile prior to the pandemic, almost 30% lower than the current rate. While the gap between then and now might seem insurmountable, keep in mind that spot rates have already fallen 23% from their peak in early January. Diesel prices will, however, continue to provide upward pressure on spot rates. In short, spot rates are unlikely to return to $2.10 a mile, but they might soon be moving into the same neighborhood.
Of the 102 lanes from Truckstop.com’s load board, only 19 reported weekly increases, up from last week’s 13 lanes but not up enough to provide relief to carriers. The most drastic increases were found on peripheral lanes in New England: For example, Syracuse, New York, to Hartford, Connecticut, jumped 25 cents per mile to $4.39 a mile, well above the national average.
Ever since the supply chain disruptions early in the pandemic, shippers have been increasingly shifting their contract bid cycles to shorter periods so as to keep better pace with a volatile market. Now that data has come in from the Q2 renegotiations, it is clear that shippers have realized their newfound pricing power. Contract rates, which are the base linehaul rate excluding fuel surcharges and other accessorials that are included in spot rates, fell 9 cents per mile to $2.81 a mile. This decline bodes ill for those carriers hoping that contract rates would insulate them from the rapid decline seen in the spot market. Nevertheless, contract rates are still up 16.1% y/y, so all is not yet lost for those carriers.
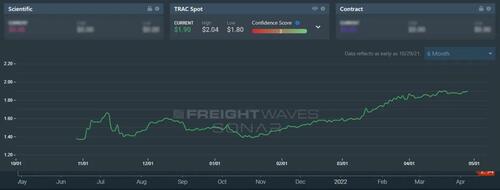
There are also the backhaul lanes to consider, many of which have hit their floor on rates and are now steadily increasing. Of these lanes, Dallas to Los Angeles is one of the most interesting, since it shares some characteristics with a backhaul lane but not others. Dallas is currently the third-largest outbound market in the country, yet carriers are covering loads from it to Los Angeles at rates near their operational cost. Because of that razor-thin margin, spot rates (which include fuel surcharges) on this lane are mainly affected by shifting diesel prices.
As a result, FreightWaves’ Trusted Rate Assessment Consortium (TRAC) spot rate from Dallas to Los Angeles has risen only 2 cents per mile over the past week to $1.90 but has spiked by 52 cents per mile over the past six months. These increases translate to a 1.1% gain w/w and a 37.7% gain over a six-month period. Meanwhile, diesel prices have risen by a comparable 1.2% w/w and by 38.4% over a six-month period.
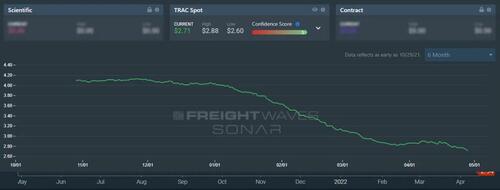
The opposite is true for rates along headhaul lanes, where carriers had a comfortable margin above their operating costs. For example, the FreightWaves TRAC spot rate along the extremely dense lane from Los Angeles to Dallas has fallen 7 cents per mile over the past week to $2.71 a mile and has plummeted a staggering $1.38 per mile over the past six months.
With rejection rates continuing to fall as they have been, shippers have no incentive to keep increasing or even maintaining those contract rates set in previous quarters. Instead, shippers have firm possession of pricing power for the moment and, from the looks of it, will exercise it to the best of their ability. Except on lanes in which fuel cost is a significant factor, neither contract nor spot rates should be expected to reverse course anytime soon.
Tyler Durden
Sat, 04/30/2022 – 17:30
Zero Hedge’s mission is to widen the scope of financial, economic and political information available to the professional investing public, to skeptically examine and, where necessary, attack the flaccid institution that financial journalism has become, to liberate oppressed knowledge, to provide analysis uninhibited by political constraint and to facilitate information’s unending quest for freedom. Visit https://www.zerohedge.com
