Goldman Trader: The State Of The Market Is To Bleed To Lower Lows Interrupted, On Occasion, By Vicious Short Squeezes
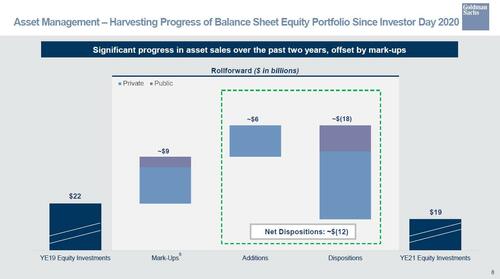
At the end of March, Goldman’s head of hedge funds sales Tony Pasquariello unexpectedly took a bearish contrarian position to the conventionally bullish house view, warning that “This Rally Is Nothing But A Huge Bear Market Squeeze; Stocks Will Be Lower “Over The Next Few Weeks.” A few days later, in early April, when many of his Goldman peers were predicting an imminent bounce in stocks, the bank’s head of Hedge fund sales warned that “The Recession Signal was Once Again Hiding In Plain Sight,” something which the bank’s CEO was aware of, considering Goldman’s massive, $18 billion in very quiet stock sales over the past two years (a classical distribution pattern).
Fast forward to mid-April, when Pasquariello again was the lone Goldman voice warning that “The Best Days Are Behind Us, And We’ve Never Seen A Setup Quite Like This Before.” Needless to say, he was right again.
So in a world where so many professional strategists have no idea what to do or say, and in most cases are just parroting trite legacy recos like BTFD (see any weekly note from Marko Kolanovic), what does Pasquariello think will happen next? Unfortunately for the bulls, nothing good: “the more time we spend near the lower goal post, the more I question whether the state of the market is a genuine range trade … or a steady bleed to lower lows that’s interrupted, on occasion, by vicious short squeezes.“
Below we excerpt the key highlights from his latest report (full report available to professional subscribers in the usual place).
markets / macro :: a high velocity trading range
The high velocity trading environment carries on. You know this by now, but to set the scene: the stock market fell apart during April. Furthermore, with the exception of the energy space, there was a nowhere-to-hide element to the selloff. Well, for the moment, the negative momentum has been arrested — thanks to an on-the-screws, if non-intimidating, Fed meeting. In the doing, S&P has returned to the bottom end of trading range that has largely defined the past three months.
In full disclosure, the more time we spend near the lower goal post, the more I question whether the state of the market is a genuine range trade … or a steady bleed to lower lows that’s interrupted, on occasion, by vicious short squeezes.
Looking forward:
- for the bulls, the thesis to falsify is this: inflation will force the Fed to tighten aggressively into a slowdown.
- For the bears, the thesis to falsify is this: the strength of the labor market will be sufficient to stave off recession.
In the end, you take what the market gives you, and for now I continue come out in the same place: buy dips below 4200, sell rips over 4500 (and, if I’m going to be wrong, it’s more likely to the downside than to the upside).
To conclude, I’ll tag in long-time colleague Dominic Wilson, who captures the macro narrative of the moment, and makes a key point on where to best place the bet:
As long as inflation is well above target and the labor market still extremely tight, the logic of tighter financial conditions and slower growth is hard to avoid. The more resilience that activity and equity markets show, the higher rates will likely need to go. For that reason, a period of easing financial conditions again sowed the seeds of its own demise. Continued Fed hawkishness — both an increasing embrace of 50bp moves and renewed focus on QT — have helped to push real and nominal yields to new highs … until the inflation/labor market dynamics change on a more sustained basis, the pressure for tighter financial conditions is unlikely to abate for long. while equity and credit weakness are driving this tightening dynamic, we think a sustained higher rate structure is still its clearest implication as long as recession risks stay at bay.
* * *
What follows from here is one table and a batch of charts:
1. a level set on the inflation outlook from US economics … part of me thinks this looks like stickier-for-longer, the other part of me thinks the Fed would declare some form of victory in the mid-2’s:
2. Speaking of inflation, with credit to Ronnie Walker in GIR, a simple plot of the Employment Cost Index. I’m inclined to think this scream higher is a big deal — as Joe Briggs pointed out to me, Chair Powell said the Q3’21 release was the data point that made him rethink the speed of taper — and, given the ongoing and immense gap between labor supply and demand, I have a hard time thinking these pressures magically disappear:
3. An inconvenient truth … of 12 possible options, yes, May through October is the worst six-month period of the year for S&P (credit to Ryan Hammond in GIR):
4. If you bought S&P 12 months ago, as of yesterday, you were underwater … and, retail outflows continue beyond the standard tax seasonal. As we move forward, I’d keep a close eye on that light blue line:
5. There’s little doubt that cost pressures are building, everywhere. that said, this level sets the magnitude of excess cash held by both households and businesses (the dark blue and light blue lines are what stick out to me here):
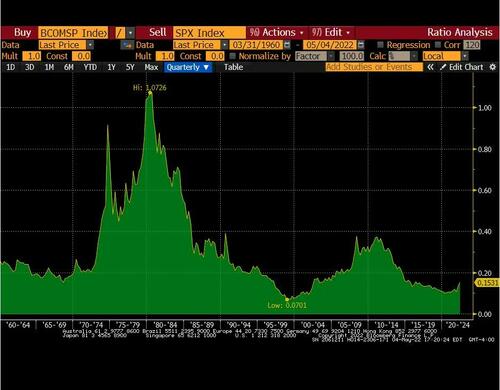
6. With thanks to a client who knows a thing or two about investing in commodities, take a step back and consider the big picture: commodities (BCOM spot index) vs equities (S&P). One argument: commodities have moved a lot over the past two years — for long-term investors, however, they are still quire cheap when compared to financial assets:
7. A chart of MSCI World, ex-US, which is below 2007 prices:
8. I remember back in 2018 when industry folks got excited about clipping nominal coupons in US 2-year notes for the PA. In the context of challenging the TINA argument for stocks, perhaps a viable alternative has been put on the table … But, that would require an acceptance of 8% inflation today vs 2% inflation back then:
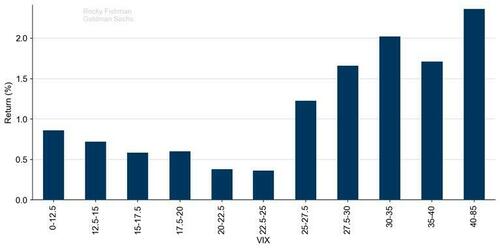
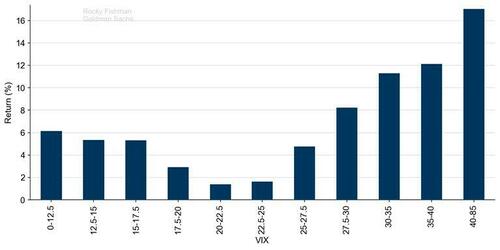
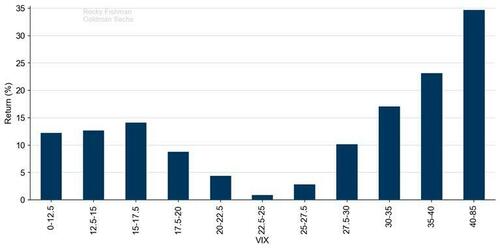
9. To conclude, what level of implied volatility set the stage for the best equity returns? Answer: S&P performs well following periods when VIX was somewhat low (e.g. in the teens) … it performs best when vol has been very high (e.g. north of 25) … it’s above-average vol (e.g. in the low 20’s) that generates the worst performance. given that VIX data only goes back to 1993, as a longer-term check we tested S&P returns vs 1-month realized vol going back 80 years — that data shows a similar pattern. I give full credit to Rocky Fishman in GIR for all of this work:
1-month returns: worst performance around VIX 20-25, highest with VIX>27.5. S&P 500 total return 1-month total returns, based on VIX ranges, 1993-present
3-month returns: lowest at VIX=20, consistently rising above that point. S&P 500 total return 3-month total returns, based on VIX ranges, 1993-present
6-month returns: worst performance with VIX 20-30, highest with VIX very high. S&P 500 total return 6-month total returns, based on VIX ranges, 1993-present
12-month returns have been lowest with VIX in mid-20’s, highest with VIX above 30. S&P 500 total return 12-month total returns, based on VIX ranges, 1993-present.
More in the full note available to pro subscribers.
Tyler Durden
Sun, 05/08/2022 – 13:25
Zero Hedge’s mission is to widen the scope of financial, economic and political information available to the professional investing public, to skeptically examine and, where necessary, attack the flaccid institution that financial journalism has become, to liberate oppressed knowledge, to provide analysis uninhibited by political constraint and to facilitate information’s unending quest for freedom. Visit https://www.zerohedge.com

