September Payrolls Preview: “Bulls Need A 100k Print For The Market To Alter Its Fed Expectations”
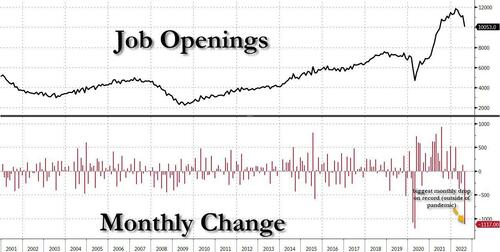
Prior to Friday’s NFP (and CPI next Wednesday), the market has been oscillating between the “hawkish Fed” and “Fed pivot” narrative. While the JOLTS Job Openings and the ISM Manufacturing employment index showed more evidence of a slowing labor market…
… yesterday’s stronger than expected ADP/ISM Services once again proved the economy still remains strong and therefore weakens the hope of a near-term pivot from the Fed. In a nutshell, according to JPM’s trading deks, with consensus expected tomorrow’s NFP to print +255k, Equity bulls would need a print ~100k to see the market alter its Fed expectations.
That said, many have said that in the absence of a huge outlier (to the downside) what markets and the Fed will be focusing on will be the participation rate (look for a big bounce here to confirm the recent slump in job openings) and hourly earnings: anything below 5.0% Y/Y and a 0.1% or lower sequential number will be greeted by the market.
Want more? Here is Newsquawk with a more detailed preview of what to expect tomorrow:
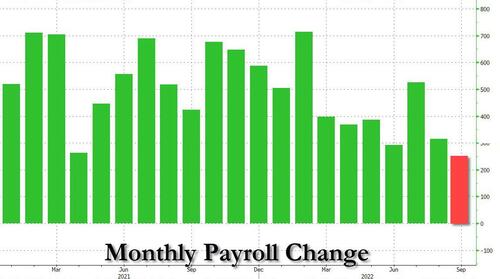
- The headline rate of payrolls growth is expected to resume cooling in September, with the consensus looking for 255k payroll additions (vs 315k in August);
- The jobless rate is seen unchanged at 3.7%, and there will also be focus on the participation rate after a welcome rise in August.
- Wage growth is expected to continue, although the annual rate is expected to cool a touch.
- Traders will be framing the data in the context of Fed policy; there are building hopes that the central bank might relent on some of its hawkishness if its policy tightening gives rise to financial stability concerns as it moves policy further into restrictive territory – these concerns could be exacerbated by soft economic data, as seen this week after the release of the Manufacturing ISM and JOLTs data, which fueled bets that the Fed would not be as aggressive with rate hikes ahead.
PAYROLL GROWTH: Analysts expect 255k nonfarm payrolls to be added to the US economy in September (Goldman estimates nonfarm payrolls rose by 200k in September, 50k below consensus and a slowdown from the +315k pace in August.), with the pace of jobs growth seen easing from 315k in August;
This would represent a resumption of recent trends where payroll growth has begun to cool (3-month average 378k, 6-month average 381k, 12-month average 487k). Jobless claims data that coincides with the reference period for the establishment survey in August and September augurs well for the headline: initial jobless claims eased to 209k vs the 245k level heading into the August jobs data, while continuing claims declined to 1.347mln vs 1.412mln into the previous jobs report. Meanwhile, while the ADP’s employment data bodes well for the official payrolls data (ADP printed 208k in September, a little above the expected 200k, and improving from the previous 185k), there is a great deal of scepticism about the payroll processor’s modelling, particularly given that its new methodology did not capture the trend of the August data in its inaugural release. Business surveys were mixed; the Manufacturing ISM report gave a sobering look at the labor market, where the Employment sub-index fell into contraction territory at 48.7, 5.5 points lower than the level recorded in August; the Services ISM however, saw the Employment sub-index rise to 53.0 from a previous 50.2, suggesting employment in the services sector continues to expand, while employment in the manufacturing sector is declining.
UNEMPLOYMENT: The unemployment rate is likely to have remained unchanged at 3.7%; analysts will also be watching the participation rate, which encouragingly rose by 0.3ppts in August to 62.4%. Additionally, there will also be focus on the U6 measure of underemployment after that picked-up to 7.0% in August from 6.7% in July. In terms of signposts about how these data will impact monetary policy, JPMorgan’s analysts point to the so-called non-accelerating inflation rate of unemployment (NAIRU), a level which puts neither upward nor downward pressure on inflation. JPM explains that when unemployment is above NAIRU, inflation tends to go down, and vice versa. The CBO estimates NAIRU is currently around 4.4%, but the median estimate of FOMC participants is at 4%. JPM itself argues that the actual level might have moved higher after the pandemic: “the relation between unemployment and job openings is also consistent with a higher natural rate,” it writes, “massive sectoral reallocation over the past three years is a likely culprit for this increase.” The Fed’s most recent economic projections envisage the jobless rate rising to 4.4%, where it is expected to stay into next year.
WAGES: Average hourly earnings are seen rising 0.3% M/M, matching the rate seen in August, but with the annual measure expected to ease a little to 5.1% Y/Y from 5.2%. The Conference Board’s gauge of consumer confidence in September revealed that consumers were more optimistic about the short-term prospects for the labor market, although they were mixed about their short-term financial prospects. On this front, Fed officials have been closely monitoring the JOLTs data series, which offers a proxy on the tightness of labor market conditions (the tighter the labor market, the more wage growth economists expect ahead). In that regard, the latest JOLTs data may be welcomed by Fed officials, given that it showed labor market tightness eased significantly in the month, which might suggest that wage growth is to cool further in the months ahead. (NOTE: the latest JOLTs report was for August, not September).
POLICY IMPLICATIONS: Analysts will be framing the data in the context of the Fed’s mission to tackle surging consumer prices. BMO’s analysts argue that “as the market can now see the end of the rate hike cycle, market volatility around employment releases will increase,” adding that “the Fed has been very effective in communicating the fact that the strong underlying labor statistics have allowed it to be more aggressive in fighting inflation than they might have otherwise been; at some point this will turn, and as a result not only will the official BLS data be pivotal.” Accordingly, BMO argues that as the real economy enters the next stage of the cycle, the market will be on guard for any signs of undue stress in the labor market, given the ramifications it could have on the speed of Fed policy. Indeed, this week, soft ISM and JOLTs data both resulted in a re-pricing of Fed hike trajectory expectations (traders reason that soft data may compel the Fed to relent on some of its hawkishness, while any particularly strong economic data will embolden the Fed to continue to act aggressively with normalizing policy).
ARGUING FOR A WEAKER-THAN-EXPECTED REPORT
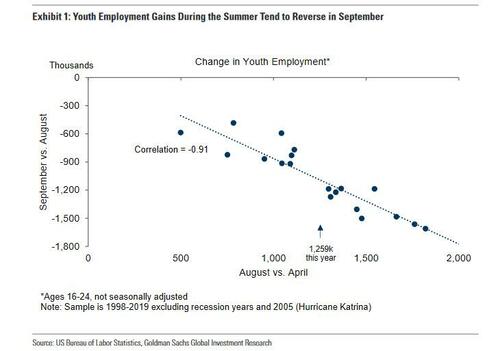
- Youth workers back to school. The loss of the youth summer workforce represents a headwind for September payrolls following strong summer employment gains for this segment. The household survey indicates that 1.3mn workers ages 16-24 were hired on net during the May-to-August payroll periods (nsa), the largest gain since 2016 outside of the 2020 reopening. As shown in Exhibit 1, September youth employment losses are strongly correlated with the summer pace of hiring in that segment, consistent with the vast majority of these workers returning to school in the fall. Additionally, this year’s particularly tight labor market suggests that many of these newly vacant positions remained unfilled during the September survey period. There is also find a negative correlation between youth summer hiring and the September nonfarm payroll surprise (relative to consensus, correlation of -0.47). These relationships would imply a roughly 35k nonfarm payroll miss and a roughly 110k drag on youth employment in tomorrow’s report (mom sa).
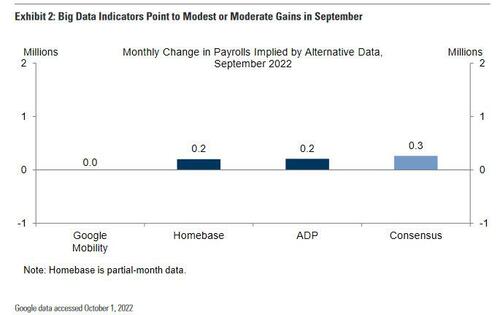
- Big Data. High-frequency data on the labor market were mixed-to-weaker inn September, with each of the three measures available this month consistent with at-or-below consensus job growth (see Exhibit 2).
- September first-print bias. As in August, payrolls have exhibited a tendency toward weak September first prints, which may reflect a recurring seasonal bias in the first vintages of the data. September job growth has missed consensus by at least 25k in 4 of the last 5 years and in 6 of the last 10 years. Relatedly, September payroll growth was subsequently revised higher by an average of 46k in the five years leading up to the pandemic, consistent with a negative bias in tomorrow’s report of roughly that magnitude.
- Employer surveys. The employment components of business surveys generally decreased in September. Goldman’s Services employment survey tracker decreased by 1.0pt to 52.2 and its manufacturing survey employment tracker decreased by 1.7pt to 52.9.
- Job cuts. Announced layoffs reported by Challenger, Gray & Christmas increased 28.9% month-over-month in September, following a 9.3% increase in August (SA by GS).
ARGUING FOR A STRONGER-THAN-EXPECTED REPORT
- Jobless claims. Initial jobless claims decreased during the September payroll month, averaging 220k per week vs. 246k in September but up from 175k in August. Residual seasonality and other non-economic factors explain much of the variation in initial claims over the last few months, and the overarching message from the jobless claims data is that layoff rates remained very low in Q3. Continuing claims in regular state programs decreased 66k from survey week to survey week, although they may also be affected by residual seasonality.
- Job availability. JOLTS job openings surprised to the downside, declining by 1.1mn to 10.1 million workers in August. However, the level of job openings nonetheless remains elevated relative to history. The Conference Board labor differential—the difference between the percent of respondents saying jobs are plentiful and those saying jobs are hard to get—edged up by 2.0pp to 38.0%.
NEUTRAL/MIXED FACTORS
- Seasonal factors. In contrast to those of the spring and summer months, the September seasonal factors have not evolved dramatically in recent years. The September month-over-month hurdle for private payrolls was -618k in 2021 compared to -665k in 2019 and -695k in 2017 (which unlike 2019 was also a 5-week September payroll). On this basis, September 2021 was sequentially more difficult by 50-75k. However, this could reverse for September 2022 based on the trend in recent months toward favorable year-on-year evolution in the factors. On net, Goldman is not assuming a significant tailwind or headwind from the seasonal factors (compared to a seasonality tailwind of as much as 100-200k in the previous report).
- ADP. Private sector employment in the ADP report increased by 208k in September,n in line with expectations for 200k.
Tyler Durden
Thu, 10/06/2022 – 22:11
Zero Hedge’s mission is to widen the scope of financial, economic and political information available to the professional investing public, to skeptically examine and, where necessary, attack the flaccid institution that financial journalism has become, to liberate oppressed knowledge, to provide analysis uninhibited by political constraint and to facilitate information’s unending quest for freedom. Visit https://www.zerohedge.com


