The Yield Curve Is Now In The Deepest Inversion Since 1981
Authored by Ryan McMaken via The Mises Institute,
In today’s episode of Radio Rothbard, Mark Thornton and I both mentioned the yield curve’s inversion as an alarming indicator of a significant recession in the not-too-distant future.
For more on why an inversion of the yield curve predicts recession can be found here and here.
Thornton mentioned that the most recent inversion of the yield curve is no small or minor inversion, but is an inversion deep into negative territory. This, Thornton notes, gives us good reason to expect a serious economic event, whether a recession or even a full-blown economic crisis.
How big is big when it comes to the latest inversion?
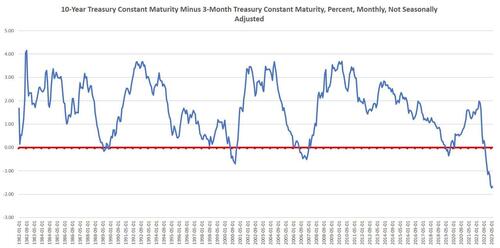
To measure the magnitude of the inversion, a time series of the gap between the yields on a long-term and a short-term is calculated. The most common-used measure of this is the gap between the 10-year Treasury and the 3-month Treasury. If we graph this difference between the 10-year and the 3-month, we can see that we’re now experiencing the largest inversion in more than 40 years:
In June, the average gap was -1.67. That’s far deeper into negative territory than anything we’ve seen since 1981, 42 years ago. As we noted on the podcast, these sorts of inversions have reliably preceded recessions for several decades.
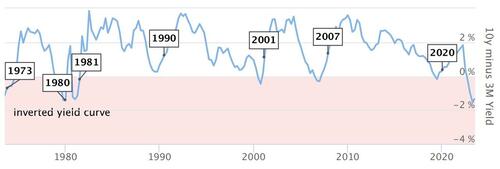
As we can see in this graph that takes a longer time frame going back 50 years, the recession of the 1970s and the 1980 recession and the severe 1981-1982 recession were all preceded by a yield curve inversion.
Moreover, to find an inversion deeper as the current one, we have to go back to 1980.
The only period showing a larger inversion that what we saw during the 1970s was in the lead up to the Great Depression in 1928 and 1929.
In response to this, some people might say “if the yield curve is so inverted, where is the mass unemployment and recession?”
Well, there is a generally a sizable lag between the yield curve inverting and the onset of recession.
For example, the yield curve inverted in 1989, but the 1990 recession did not begin until 13 months later. Similarly, the yield curve inverted in August 2006, but the Great Recession did not begin until December 2007, 16 months later. The yield curve again inverted in May 2019, and it is extremely likely there would have been a recession in late 2020 had the Federal Reserve not engaged in massive amounts of monetary pumping throughout the year to blow a series of bubbles designed to cover up the economic effects of forced lockdowns on the economy.
Now, the yield curve has been inverted since November 2022, but only seven months have passed since then. Experience suggests we could be looking at at least another six months before the effects are clear.
Tyler Durden
Fri, 07/21/2023 – 11:45
Zero Hedge’s mission is to widen the scope of financial, economic and political information available to the professional investing public, to skeptically examine and, where necessary, attack the flaccid institution that financial journalism has become, to liberate oppressed knowledge, to provide analysis uninhibited by political constraint and to facilitate information’s unending quest for freedom. Visit https://www.zerohedge.com


