Gamma Trapdoor Opens: Markets Brace For “Shock Down” As Dealers Puke
When commenting on the market’s surprising resilience on Friday, and remarkable index “pins” at the key numbers of 29,000 for the Dow and 3,333 for the S&P, we said that much if not all of this had to do with the build up of dealer gamma, most of which however was set to fade away after Friday’s opex.
Sure enough, while it may be a coincidence, the Monday mauling observed so far is taking place not only as a result of the dismal coronavirus news over the weekend but as much of the massive dealer gamma buffer has vaporized.
Commenting on his favorite topic, namely market bias and positioning due to gamma imbalances, Nomura’s Charlie McElligott writes that this post-opex “release” of mechanically-insulating “Long Gamma” flow from Dealers finally “sees the market allowed to come unhinged” with the specific catalyst being the weekend escalation of offshore covid-19 cases.
Specifically, while the Nomura quant highlights both the deteriorating trajectory of the coronavirus pandemic which is “driving the next escalation in the “risk-off” trade—with European / US Equities, Crude and Copper pummeled, while USTs (new record low yields in 30Y—as the “Everything Duration” theme only accelerates –more DEF over CYC), Gold, Yen and VIX explode higher”, which in turn is escalating the “Imminent global recession” narraitve first discussed here last night when we noted the 1.40% “tipping point” in the 10Y TSY, McElligott points out that “a significant feature of this morning’s cross-asset volatility begins-and-ends within the Equities space thanks to the “un-clenching” of markets post this past Friday’s monthly Op-Ex, as the standard “UP in realized vol” and “LARGER high-low trading range” in the subsequent 5d period after Op-Ex “kicks-in,” due to the absence of previously insulating “Long $Gamma” flows from Dealers.”
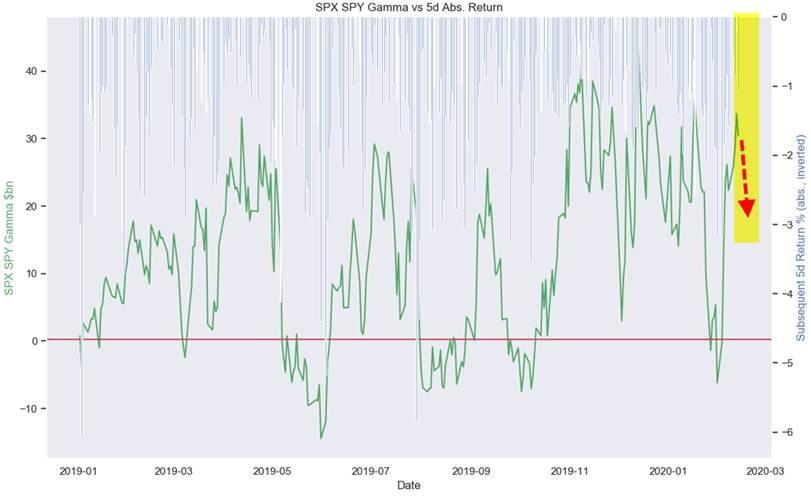
As discussed here most recently last week, one of the drivers behind the market’s steady meltup and inability to drop was what McElligott calls the prolific “Long $Gamma” profile of the US Equities market, “which had kept us sticky (at the major $Gamma strikes in SPX & QQQ) over the past two weeks as we approached US Feb Op-Ex because Dealers have “generically” had to “buy weakness / sell strength” to remain hedged and which had thus provided us a natural counter-flow “buffer” to large market shocks in any direction.“
However with Feb op-ex now in the rearview mirror and much of the legacy positioning overhang gone, “we have seen this Gamma profile in US Equities index & ETF options collapse lower, which in-turn is allowing for today’s long-awaited “big move” in Equities.”
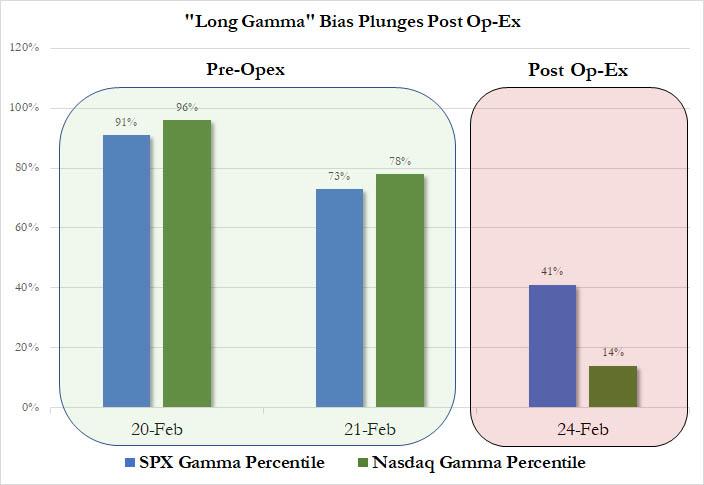
What does this mean in English? As the chart below shows, where the gamma “bias” pre-opex was in the 90%-ile range ahead of Friday’s opex, with the Nasdaq especially well-pinned at 96%, we have subsequently seen a plunge in “long gamma” exposure, with the S&P percentile plunging to 41% while Nasdaq tumbling as low as 14%.
Now, as anyone who is looking at the way futures are trading this morning will attest, this is a problem because while the gamma buffer is now gone, positioning is still as extreme as it has been for much of the past month. Think of its as the Wile E. Coyote moment just before he looks down as he runs off the cliff.
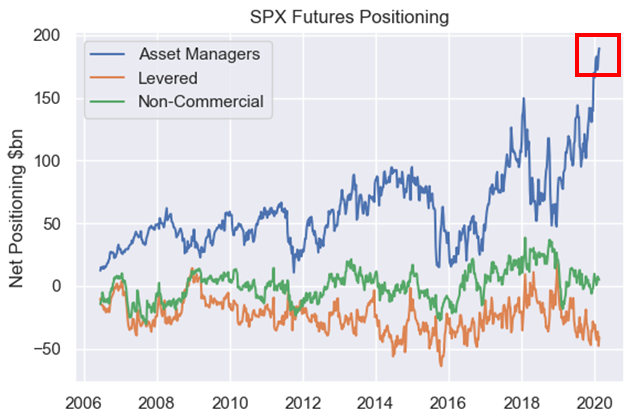
As McElligott ominously concludes, from a flow perspective, “the danger on such an impulse move lower is clearly then this ENORMOUS “long” in SPX futures held by Asset Managers, currently through last week +$189.4B net long—100th %ile since data began in 2006,” or as he puts it, there is a giant risk of a “shock-down” move in equities.
Stated simply, today’s selloff has set in play a pernicious feedback loop whereby gamma will now collapse, forcing dealers to chase the move lower and sell even lower, which in turn depresses gamma even more, leading to more selling, further gamma rebalances lower, and so on until either a major bullish catalyst emerges or central banks step in.
Therefore the big question for today’s session will be “how the market absorbs the current $190B (100th %ile since 2006) net $ position held by Asset Managers in SPX and aggregate across US Equities Futs (SPX, NDX and RTY) IF they choose to take some off the table.”
Judging by where futures are trading, the answer so far is “not good.”
That said, there is a modest silver lining to today’s positioning: according to the Nomura’s Trend model for S&P 500 futures, CTA are unlikely to be puking just yet as their 100% sell threshold is “comfortably below the market” at around 3102 on the S&P due to the exclusive loading of longer-term windows i.e., the 3m-, 6m- and 1Y- windows – all of which are deeply “in-trend” long with “buy” signals – “which means that FOR NOW, it wouldn’t even matter if the short-term 2w- and 1m- models signaled SELL because they have no loading / weighting.”
In other words, while the loss of gamma may no longer act as a market supporting buffer, at least there won’t be a forced puke by CTAs… yet.
That said, as McElligott concludes, for and “vol targeting”,”risk-control” systematic investor, even without the triggering of sell thresholds, “a natural de-leveraging of the recently very high gross-exposure of this position is almost a certainty because trailing realized vols will be dragged higher the longer we sustain these levels.” Think of it as momentum: once it starts, usually well after market inflection points, it continues to roll far long time, although in this case there may be an expection: as Nomura points out, at least some systematic VIX “roll-down” strategies have already begun getting “stopped-out”…
Tyler Durden
Mon, 02/24/2020 – 08:48![]()
Zero Hedge’s mission is to widen the scope of financial, economic and political information available to the professional investing public, to skeptically examine and, where necessary, attack the flaccid institution that financial journalism has become, to liberate oppressed knowledge, to provide analysis uninhibited by political constraint and to facilitate information’s unending quest for freedom. Visit https://www.zerohedge.com


