“Very Intense Plunge”: Top Hedge Fund Longs Suffer Historic Crash As Top Shorts Outperform… And Much More Pain Is Coming
Total announced stimulus in the US, EU and UK this week was $4.2 trillion, and counting. But for those looking to buy this dip, the bears remain in control of a market paralyzed by its inability to decipher the true economic impact of the virus and the unprecedented dollar shortage just below the surface.
Meanwhile, following the fastest crash from an all time high on record and the biggest VaR shock in history, hedge fund deleveraging is now accelerating (as are mutual fund redemptions) and while realized P&L volatility remains high, and hedging with options expensive, it is unlikely to stop here, at least according to Morgan Stanley. And while the stimulus creates a better backdrop for sharp/short-lived rallies now (helped by clients’ $45bn net short in SX5E futs) the bank’s view remains that we have not yet seen the bottom in index levels.
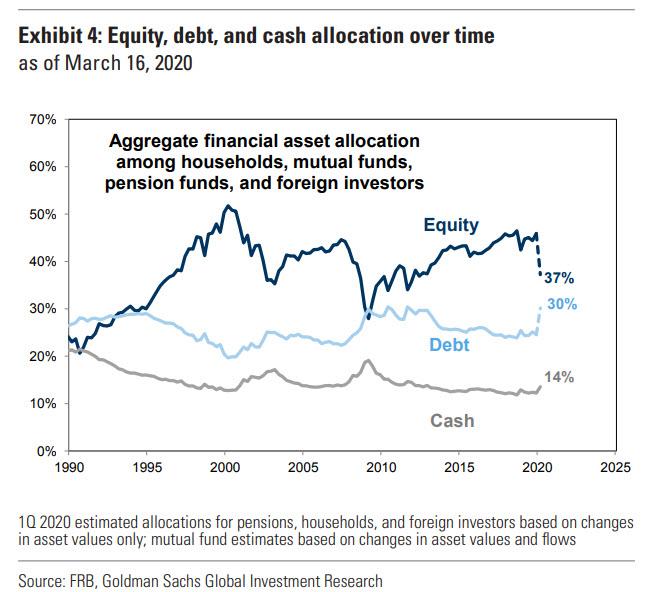
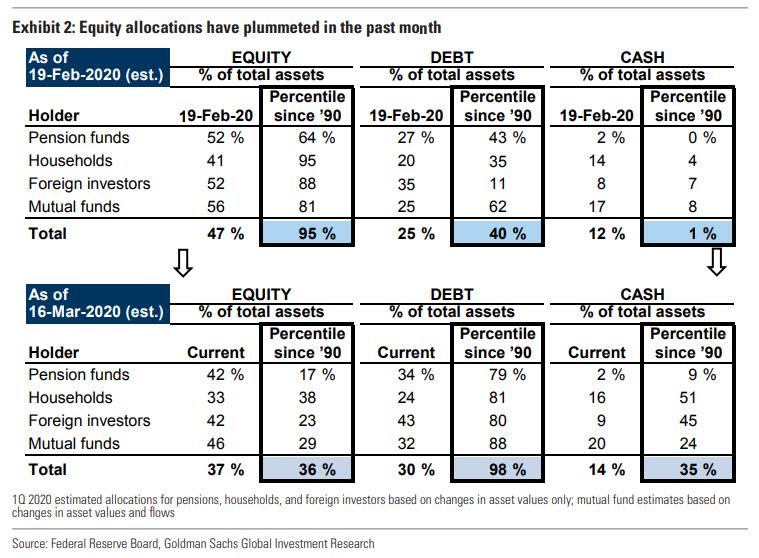
Goldman agrees, pointing out that equity allocations were near all-time highs in February but have plummeted since the start of the bear market. As we pointed out previously, in February, households, mutual funds, pension funds, and foreign investors — who collectively hold 84% of the total equity market — were more or less “all in”, and had notably overweight equity exposure in their portfolios relative to history.
In aggregate, these entities had equity allocations ranking in the 95th percentile vs. the past 30 years. In contrast, these investors had cash allocations at the very bottom of their historical allocations. However, since the all-time high on February 19, the S&P 500 has fallen by 30%, while the allocation to equities has fallen by around 10 percentage points to 37% of financial assets (36th percentile) from 47% (95th percentile). At the same time, allocation to bonds and cash have risen to 30% of assets (98th percentile) and 14% of assets (35th percentile), respectively.
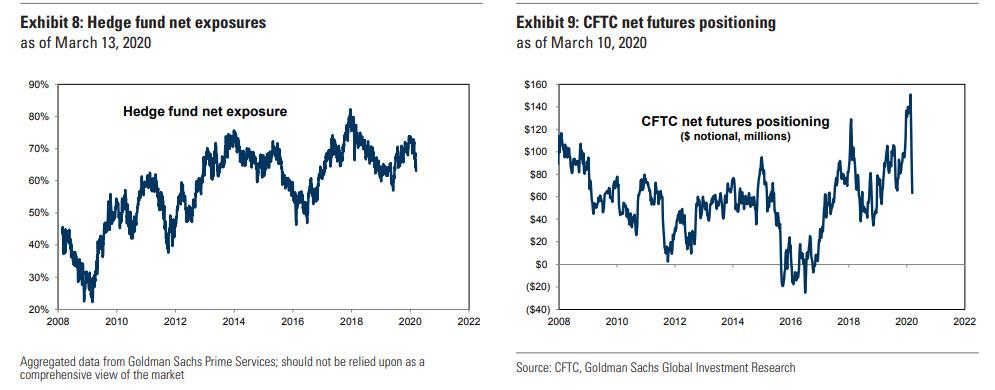
Institutional investor positioning indicators also show a significant decrease in equity exposures, but current levels remain elevated relative to the lows in past corrections. Based on data from GS Prime Brokerage, hedge fund net exposure registered 63% this week, well below the level recorded at the February 19 equity market peak (72%). Similarly, CFTC data also show a sharp decline in net futures length. However, both of these are well above the average observed during the past decade.
This 37% aggregate equity allocation among major investors currently ranks in the 36th percentile since 1990 compared with the 95th percentile in February. However, there is more selling to come, because despite the steep decline, equity allocations are still above the troughs in 2001 and 2008, and cash allocations are at just the 35th percentile vs. history.
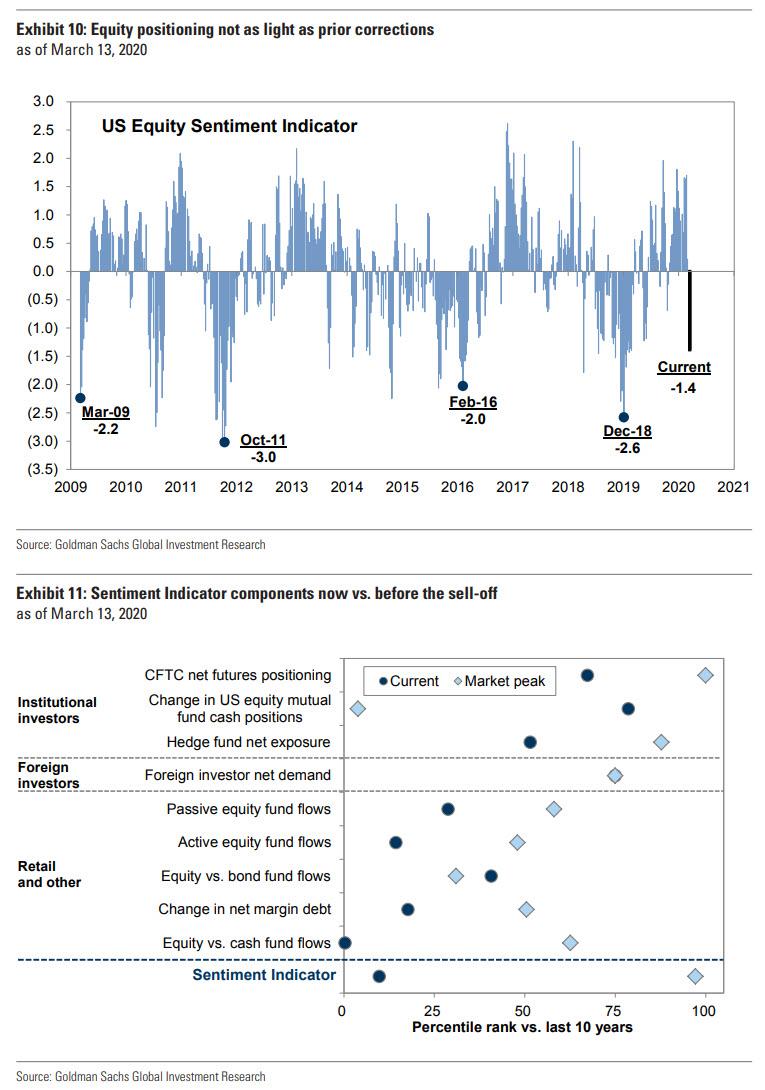
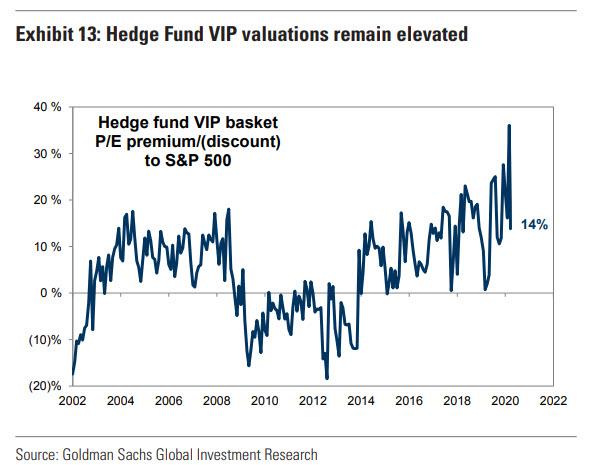
Similarly, Goldman’s high-frequency Sentiment Indicator and the valuations of favorite hedge fund stocks remain more elevated than the bank would expect at the trough of a major correction. As such, Goldman notes that it “expects that investors will continue to rotate away from equities in the near term, leading equity prices even lower.”
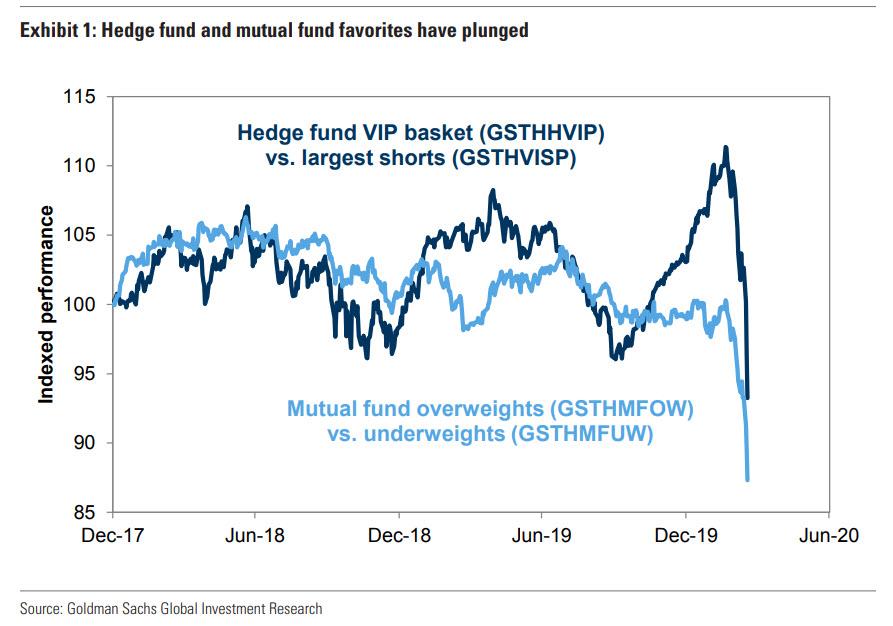
Of note is the sharp underperformance this week of the most popular stocks among hedge funds and mutual funds, which suggests that institutional investor selling has accelerated. That’s putting it mildly: whereas Goldman typically takes pride in its Hedge Fund VIP basket which it frequently praises for outperforming the broader market more than 95% of the time, it is now safe to rename it to the Hedge Fund Very Intense Plunge (VIP) basket.
Here’s why: after mostly outperforming the US stock market since the coronavirus started rattling investors in mid-February, the HF VIP basket is now down almost 29 per cent for the year, more than the S&P itself. At the same time, Goldman’s index of popular short positions has – as we have repeatedly told our readers– been far more resilient than the US stock market over the same period, declining only 13% this year. The five-day outperformance of the hedge fund shorts index versus the VIP index is the most extreme seen since Goldman Sachs started collecting the data in 2001. And it’s not just hedge funds: during the same period, the most popular Mutual Fund Overweights have lagged the largest Underweights by 700 bp (-20% vs. -13%), confirming once again that the only way to generate alpha is to do the opposite of what most people on Wall Street do.
And yet, hedge fund leverage curiously remains higher than typical in periods of severe market stress, and the valuations of their favorite stocks remain elevated relative to history.
In short, Goldman expects that the rotation away from equities will persist in the near-term as “uncertainty around the global spread and economic impact of COVID-19 remains high, volatility is at extreme levels across asset classes, and liquidity is thin.”
In this environment, investors are likely to continue cutting portfolio risk, particularly because current aggregate equity allocation of 37% is still above the troughs in 2001 (35%) and 2008 (28%) and cash allocations are still only at the 35th percentile vs. history, despite what the BofA self-serving, and completely meaningless Fund Managers Survey says.
To summarize, “a further decline in investor equity positioning, in concert with thin liquidity and a reduction in corporate buybacks, should cause the S&P 500 to fall” to Goldman’s estimated trough of 2000.
Tyler Durden
Thu, 03/19/2020 – 22:45![]()
Zero Hedge’s mission is to widen the scope of financial, economic and political information available to the professional investing public, to skeptically examine and, where necessary, attack the flaccid institution that financial journalism has become, to liberate oppressed knowledge, to provide analysis uninhibited by political constraint and to facilitate information’s unending quest for freedom. Visit https://www.zerohedge.com

