Goldman Sees Imminent “Momentum” Crash As All S&P Gains Come From Just 5 Stocks
With a third of companies having reported Q1 results so far, earnings season has proven to be neither a spoiler nor a catalyst, with modest market reaction to some truly horrific numbers as investors are now ready to ignore earnings until well into 2021 when a V or U-shaped recovery is expected to kick in.
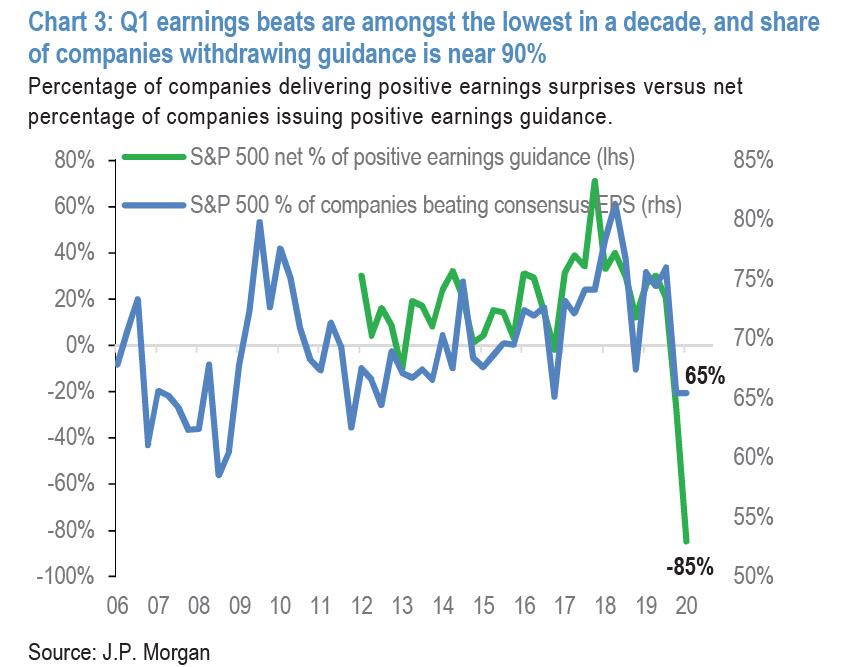
That said, the numbers have been mixed, for anyone monitoring rather than looking through them because they are the fuzziest figures since Q1 2009 just after Lehman’s bankruptcy. While 65% of US companies that have reported beat estimates (vs 50% in Europe and Japan), this represents the worst margin in a decade.
Meanwhile, those hoping for some guidance will have to keep waiting as visibility from the C-suite is so poor that almost 90% of reporting companies have withdrawn guidance. Worse, the actual numbers for Q1 which caught the tail end of March as much of corporate America shut down, are coming in horrendous with US EPS of -24% yoy is coming in some 9% lower than consensus expectations, which raises questions about whether a prevailing view for rapid earnings recovery in H2 are too optimistic, as JPM cautions. On a rolling four-quarter basis, the consensus has S&P earnings surpassing pre-crisis levels by Q4 2020, which would be tough to reconcile with the JPM Economics view that GDP will not return to pre-crisis levels until after 2021, even though JPM’s Marko Kolanovic now expects new S&P500 all time highs in the first half of 2021 (using a rather ornate DCF of the entire S&P500 to justify his view).
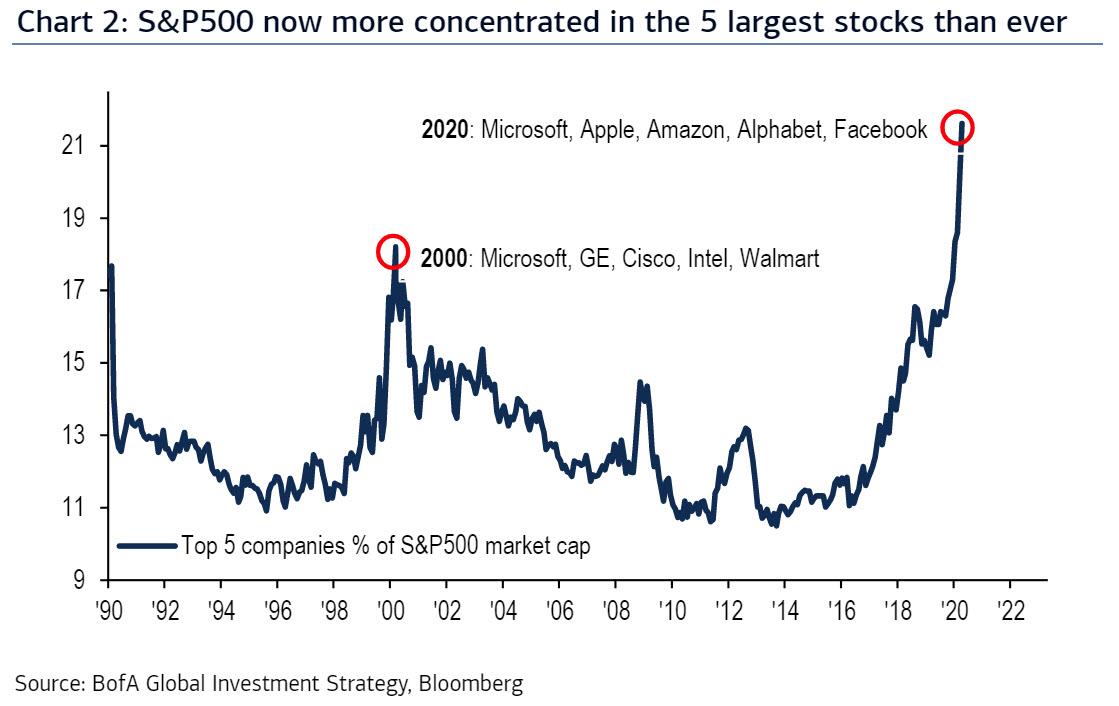
Which in turn brings us to something we showed two weeks ago when we noted that the “the S&P is now just a handful of mega stocks, because as the chart below shows the largest 5 stocks in S&P500 now account for 22% of market cap, even higher than during the dot com bubble.”
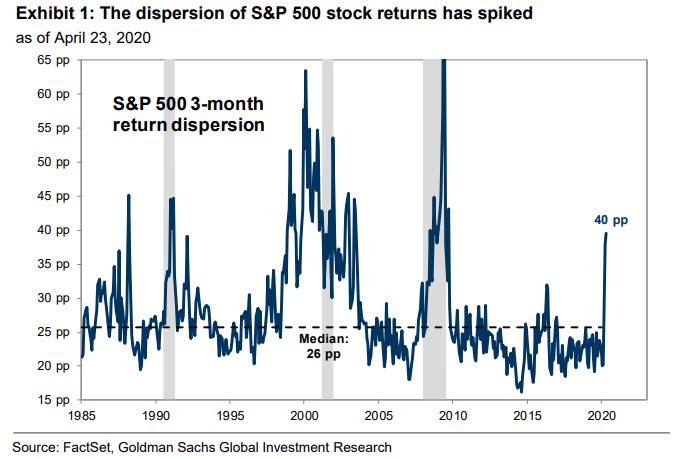
Picking up on this observation, Goldman’s David Kostin in his latest Weekly Kickstart writes that the fundamental volatility captured in 1Q earnings reports explains why stock return dispersion has jumped to the highest level since the Financial Crisis. According to the Goldman strategist, “the gap between the three month returns of the S&P 500 stock one standard deviation above the average vs. one standard deviation below the average has registered 40%, nearly twice the 10-year average of 23%.”
What is bizarre, is that this split in the market has occurred despite average stock correlations reaching the highest levels on record, a dynamic that would normally reduce return dispersion. One explanation for this paradoxical confluence is that record correlations have been outweighed by extreme price volatility and a wide gap between the outlooks for stocks perceived to be most vulnerable to the current economic shock (virtually all stocks except the 10 biggest ones) and those with the most resilient balance sheets and business models (mostly Microsoft, Apple, Amazon, Alphabet and Facebook).
To validate this observation, Kostin notes that Goldman’s Strong Balance Sheet basket has returned -5% YTD while the Weak Balance Sheet basket has returned -27%.
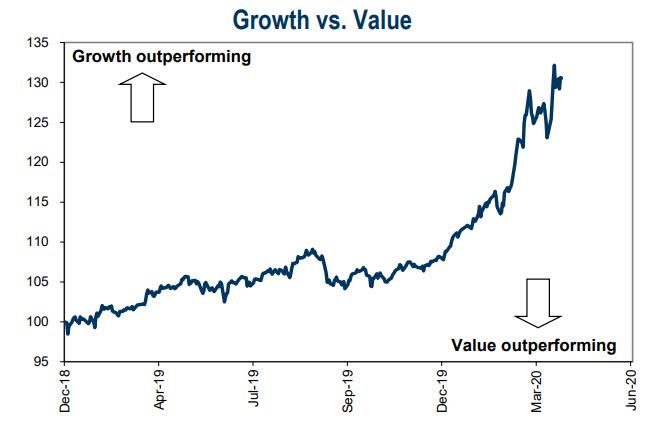
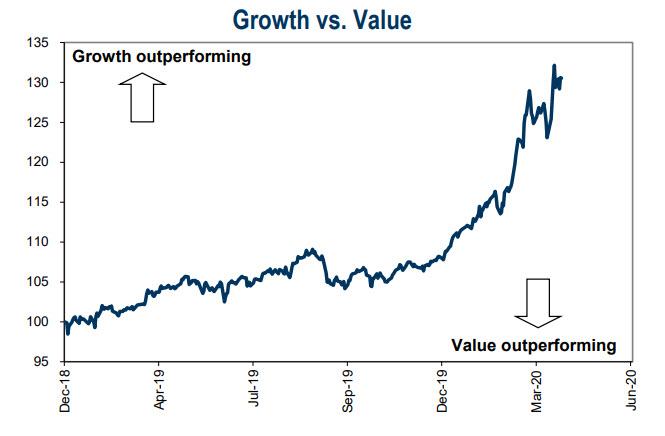
More confounding for so-called “stock pickers” is that not only did return dispersion rise during the market sell-off, but it has also increased during the market rebound. AS a result, many stocks that outperformed during the market sell-off have continued to outperform even with the S&P 500 retracing half of its drawdown, and nowhere is this more obvious than in the steamrolling of value stocks by “growth” names…
… and also of large-caps over small-caps…
where the divergence is now unprecedented.
Indeed, as shown above, as the market swooned in late February and March, investors rotated to strong balance sheets, large-caps, Technology companies, and other “quality” stocks viewed as safe havens. These stocks lagged during the first two weeks of the market rebound following its March 23 bottom but have resumed their outperformance more recently as investors remain concerned about the outlook for corporate earnings despite the boost to valuations from extraordinary policy support.
Which brings us to what is the one concern more often cited among Goldman clients. According to Kostin, the persistent outperformance of a handful of mega-cap stocks has supported the level of the S&P 500 index but raised investor concerns about narrow market breadth.
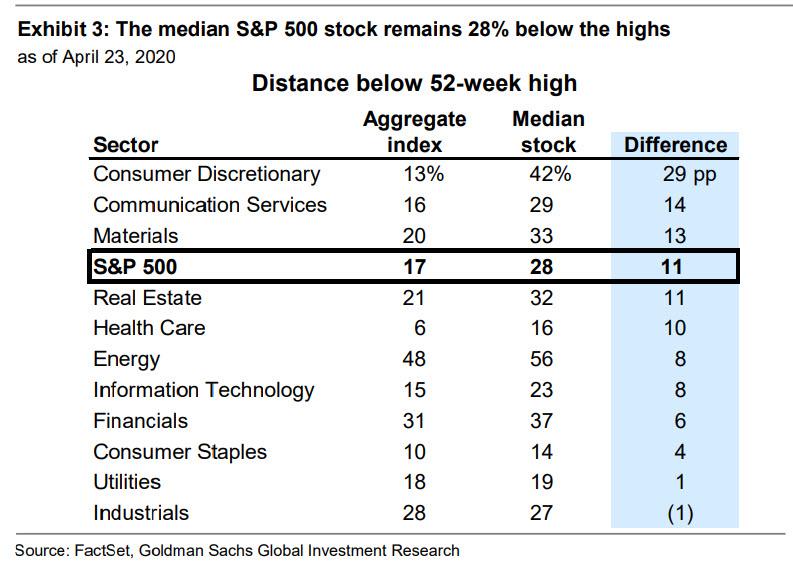
As Kostin puts it, “many market participants – ourselves included – have expressed incredulity at the fact that the S&P 500 trades just 17% below its all-time high amid the largest economic shock in nearly a century.”
However, below the surface of the market, the median S&P 500 constituent trades 28% below its record high. This 11
percentage point gap is one measure of market breadth…
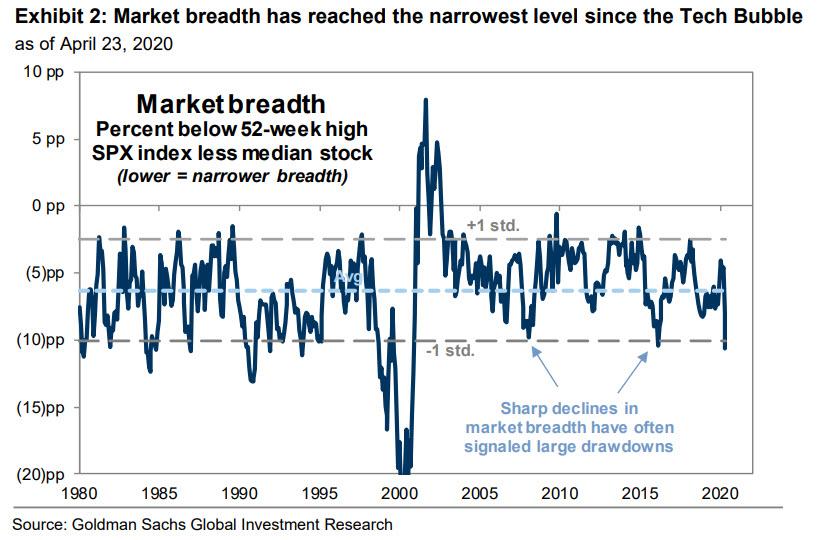
… which now stands roughly a standard deviation below its historical average.
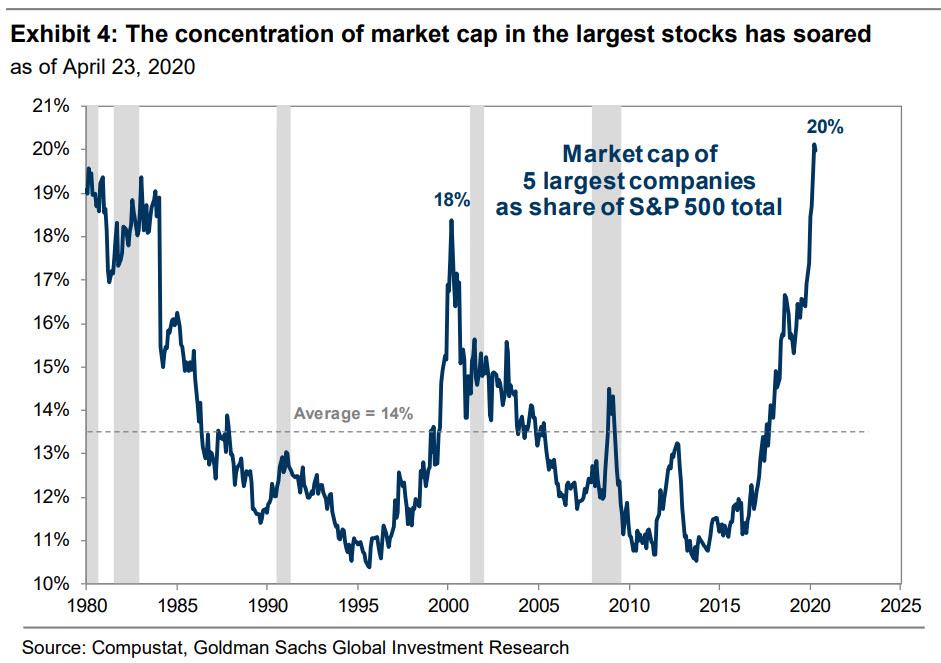
Going back to our thesis that “The Market Is Now Just 5 Stocks“, Kostin next notes that because many of the recent outperformers had also been market leaders prior to the coronacrisis, their recent gains have led to a surge in already- elevated market concentration. While coming into 2020, the five largest S&P 500 stocks accounted for 18% of index market cap, matching the share at the peak of the Tech Bubble in March 2000, since then, those stocks (MSFT, AAPL, AMZN, GOOGL, FB) have risen to account for 20% of market cap, representing the highest concentration on record.
Which brings us to Goldman’s ominous warning #1: “We opined in January that the earnings power and valuations of the top five stocks suggested they could avoid the fate of the top stocks in 2000. However, the further market concentration rises, the harder it will be for the S&P 500 index to keep rising without more broad-based participation.” In other words, if the dispersion continues to soar, and if the entire upside in the S&P500 is thanks to just five stocks, not even Goldman can see a happy ending.
If that wasn’t enough, Goldman also has an ominous warning #2, namely that sharp declines in market breadth in the past, of the kind we see now, have often signaled large market drawdowns. For example, in addition to the Tech Bubble, breadth narrowed ahead of the recessions in 1990 and 2008 and the economic slowdowns of 2011 and 2016. This is also observed empirically, as historically sharply narrowing breadth has signaled below-average 1-, 3-, and 6-month S&P 500 returns as well as larger-than-average prospective drawdowns.
That said, Goldman refuses to put a timeline to its dour outlook, and notes that periods of narrow market breadth can last for extended periods. Since 1980, the breadth measure charted in Exhibit 2 has indicated 14 episodes of breadth narrowing more than one standard deviation, as it does today. The median episode persisted for three months, with the longest lasting 27 months from 1998-2000.
However, eventually, “narrow market breadth is always resolved the same way. Often, narrow rallies lead to large drawdowns as the handful of market leaders ultimately fail to generate enough fundamental earnings strength to justify elevated valuations and investor crowding. In these cases, the market leaders “catch down” to weaker peers.” This is the scenario laid out by Nomura last week in our post “Spectacular Momentum Crash” Imminent As Record Human Hedge Fund Selling Meets Furious Robot CTAs Buying.” In other cases, an improving economic outlook and strengthening investor sentiment help laggards “catch up” to the market leaders, which also results in a violent drawdown as the leaders get repriced sharply lower.
The bottom line, however, is that in both cases, “on a relative basis the outperformance of market leaders eventually gives way to underperformance.”
What does this mean in practical terms? As Goldman concludes, since 1980, its long/short Momentum factor has generated a median unconditional 12-month return of +400 bp “but a 12-month return of -300 bp following periods of narrow market breadth like today.” In short, while it may not necessarily be “spectacular”, Goldman agrees with Nomura that a momentum crash is dead ahead. And with that pessimistic view, Goldman – which just two weeks ago called the “bottom” in the S&P500, has joined Morgan Stanley’s “notorious bear-turned-bull” Michael Wilson in warning that stocks are now overbought and that a “correction will begin soon.”
Finally, Goldman has a word of hope for all those who have been crushed by the growth-over-value and large-over-small cap steamrolling: first, small-caps and laggards have outperformed coming out of every bear market and major market correction during the last 40 year. Furthermore, “in the past, wide valuation dispersion has been a strong signal for value stock outperformance over 2- and 3-year horizons but has been a much weaker indicator for short-term returns.”
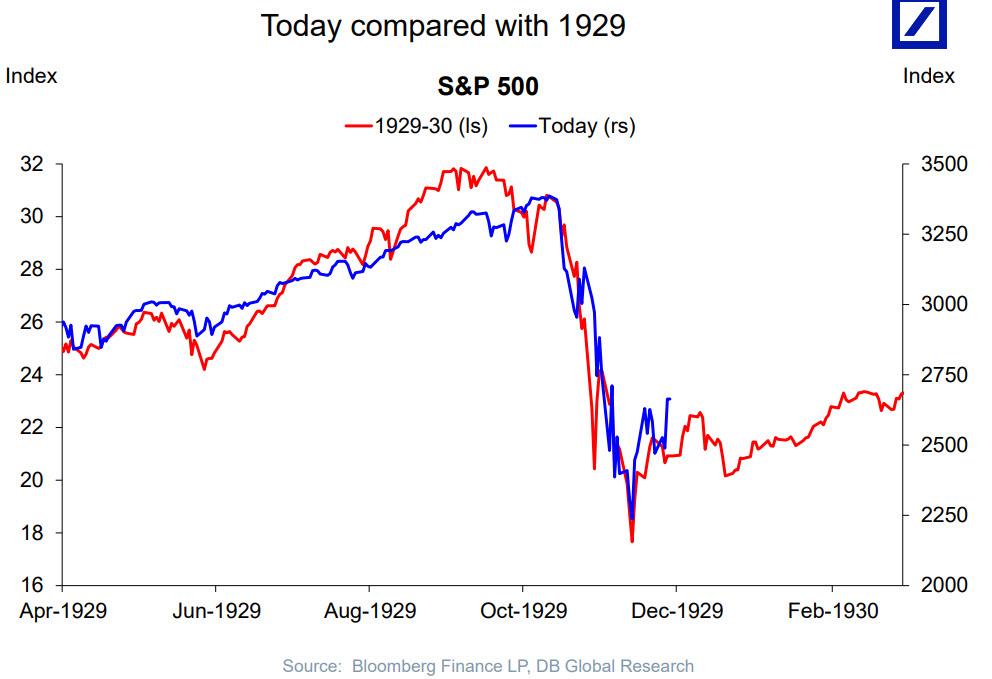
Now if only we had the same level of comfort as Goldman, that we are coming out of a major market correction instead of just enjoying a record bear market rally as shown in this chart from Deutsche Bank…
… before we enter the next one.
Tyler Durden
Sun, 04/26/2020 – 16:20![]()
Zero Hedge’s mission is to widen the scope of financial, economic and political information available to the professional investing public, to skeptically examine and, where necessary, attack the flaccid institution that financial journalism has become, to liberate oppressed knowledge, to provide analysis uninhibited by political constraint and to facilitate information’s unending quest for freedom. Visit https://www.zerohedge.com

