What’s Wrong With Chinese GDP Data?
Authored by Bilal Hafeez via MacroHive.com,
Scepticism has always surrounded Chinese growth data, especially its GDP statistics. The data is released extremely quickly after the end of a quarter and is hardly ever revised, making one wonder if it’s simply invented. Indeed, local and provincial officials are pressured to meet growth quotas handed down by the government, so there’s pressure to bias national GDP data upwards from those providing it. Here, we break down a recent Fed paper, ‘Is China Fudging Its GDP Figures? Evidence from Trading Partner Data’, to reveal a new take on assessing China’s economic activity.
What Alternative Measures have People Used?
Famously, in 2007 the current Premier, Li Keqiang, said he focused on ‘alternative indicators’ including electricity consumption, the volume of rail cargo, and the amount of loans disbursed. He added that ‘all other figures, especially GDP statistics are for reference only’.
Some have used even more innovative approaches, such as light emissions as measured by satellites. But lately these have been criticised as the data suffers from massive measurement inconsistencies. For instance, changes in the sensitivity of satellites over time.
Are There Other Non-Chinese Measures of Chinese Growth?
Import data has been shown to move closely with GDP across most countries. Whilst getting hold of Chinese import data is tricky, we can use other countries’ measures of their exports to China, which would of course correlate. This data is accurately measured since the number of importers is modest and countries have an incentive to measure trade data well for tariff purposes. Importantly, externally measured Chinese imports could then be used to test which Chinese indicators, such as the ones mentioned by Premier Li, most closely follow growth.
So What Chinese Indicators Most Closely Follow Growth?
The Fed paper looks at a suite of 14 domestic indicators that track the external measure of Chinese imports and find that 8 work best (see table below for full list, extracted from the paper).
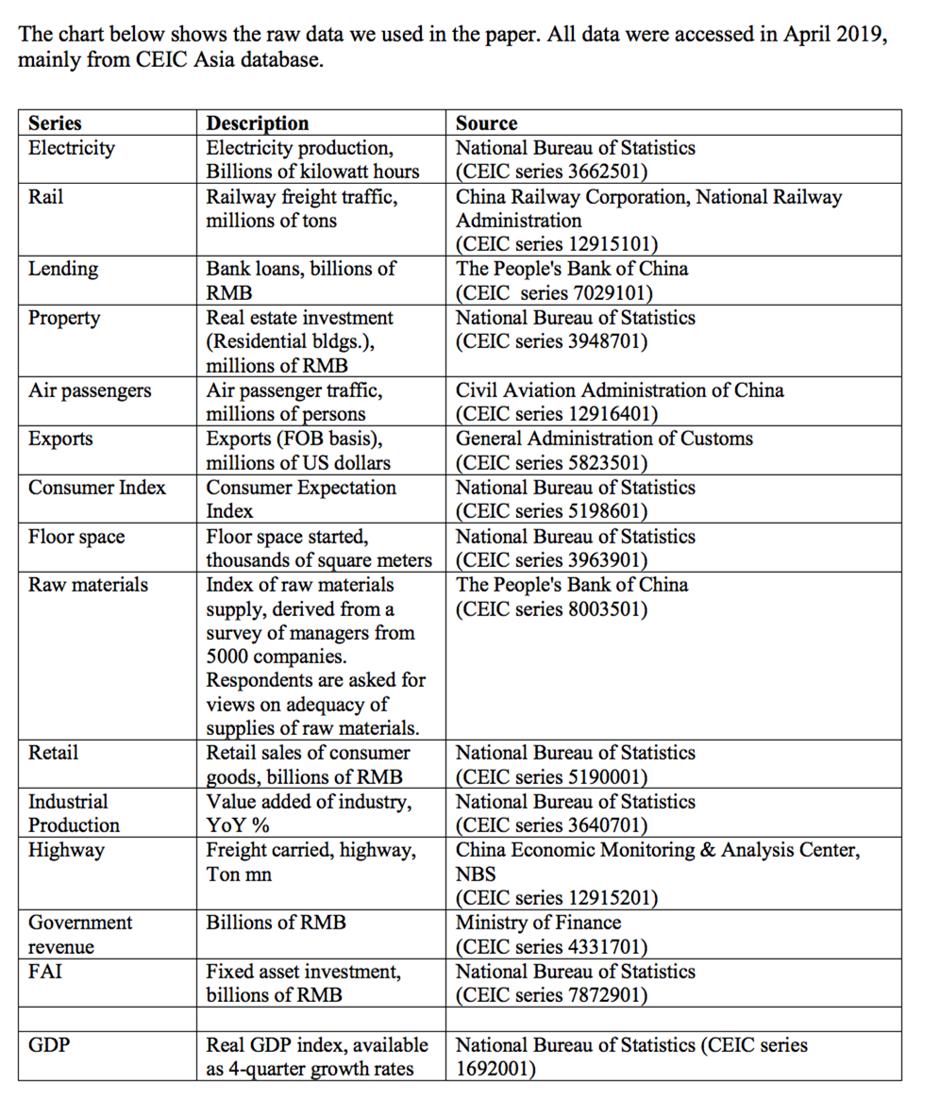
Figure 1: Data Sources
These are: electricity, exports, industrial production, an index of consumer expectations, fixed asset investment, floor space construction, retail sales, and rail freight. You’ll note that this list doesn’t include lending data, which was often found to be a countercyclical indicator. Importantly, it also doesn’t include GDP.
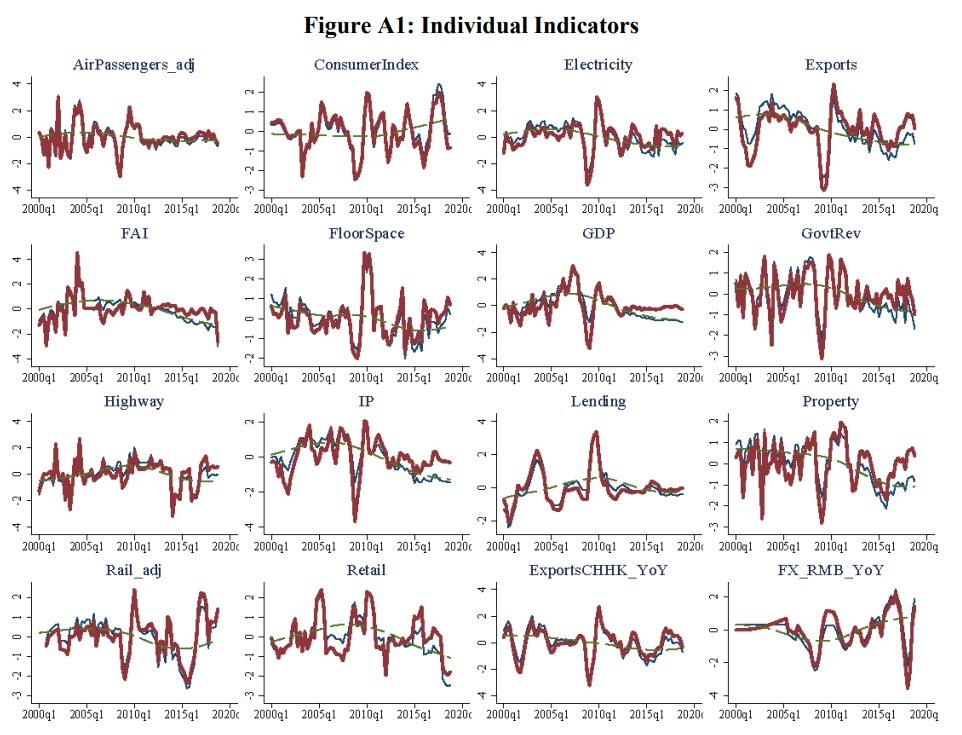
The weakest indicators of the 8 are retail sales and fixed asset investment. In the end, the Fed uses all 8 indicators to construct an overall activity called the ‘China cyclical activity tracker (C-CAT)’.
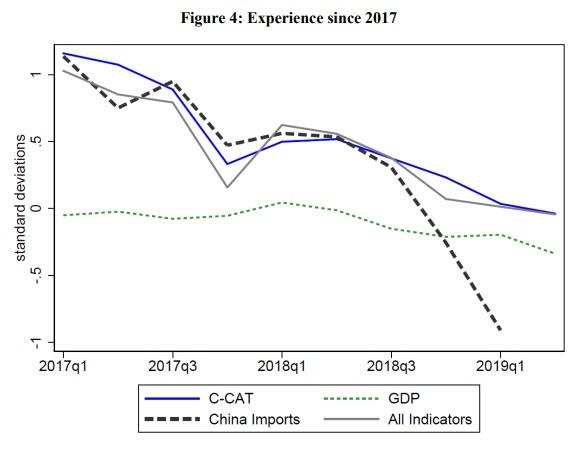
What Does the C-CAT Measure Tell Us About Recent Chinese Growth?
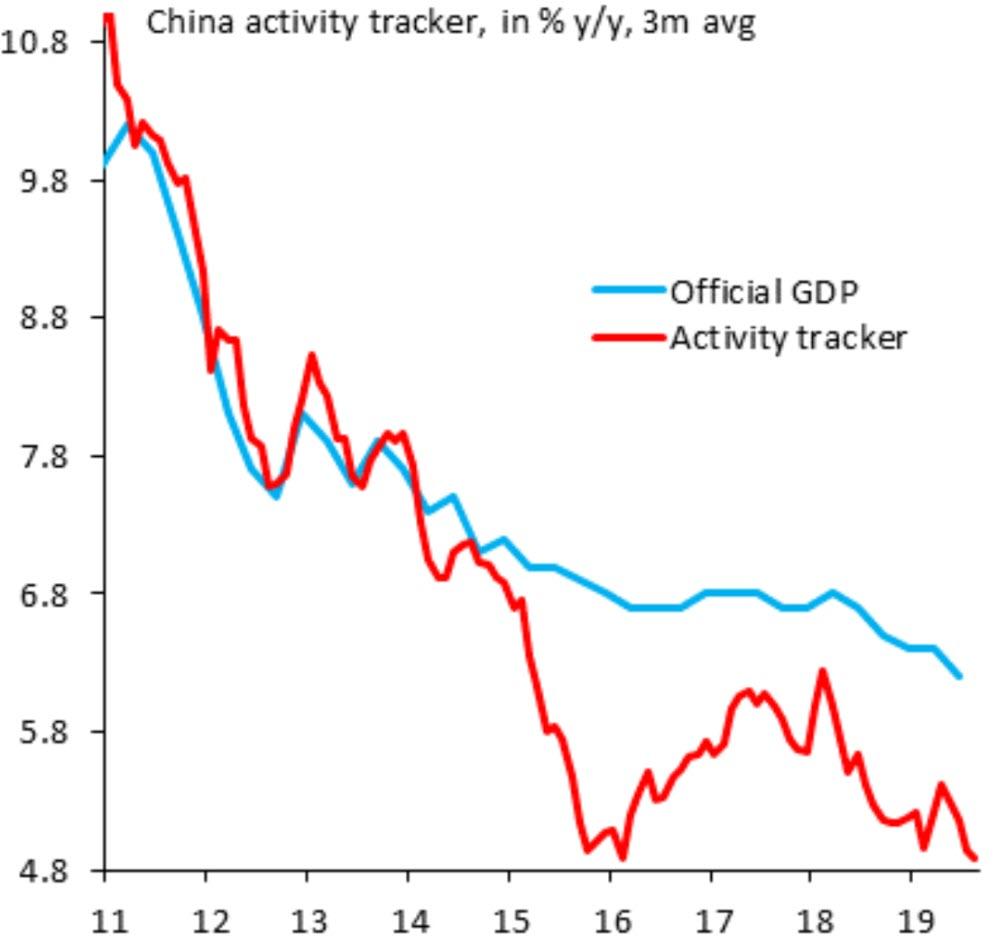
The main conclusion is that since 2013, GDP figures look suspiciously smooth. Notably, the C-CAT measure showed much slower cyclical growth in 2015 than official GDP. But the trend growth of China appears to be accurately measured by official GDP data. As for the 2019 data, official GDP data and the C-CAT measure appear to be giving similar measures for Chinese growth (see chart).
Additionally, as The IIF’s Robin Brooks recent noted: Our China activity tracker, which diverges from official GDP, remains broadly stable at around 5% y/y.
Tyler Durden
Thu, 09/26/2019 – 20:30
![]()
Zero Hedge’s mission is to widen the scope of financial, economic and political information available to the professional investing public, to skeptically examine and, where necessary, attack the flaccid institution that financial journalism has become, to liberate oppressed knowledge, to provide analysis uninhibited by political constraint and to facilitate information’s unending quest for freedom. Visit https://www.zerohedge.com