Gold ETF Holdings Hit All Time High After Longest Stretch Of Inflows Since The Financial Crisis
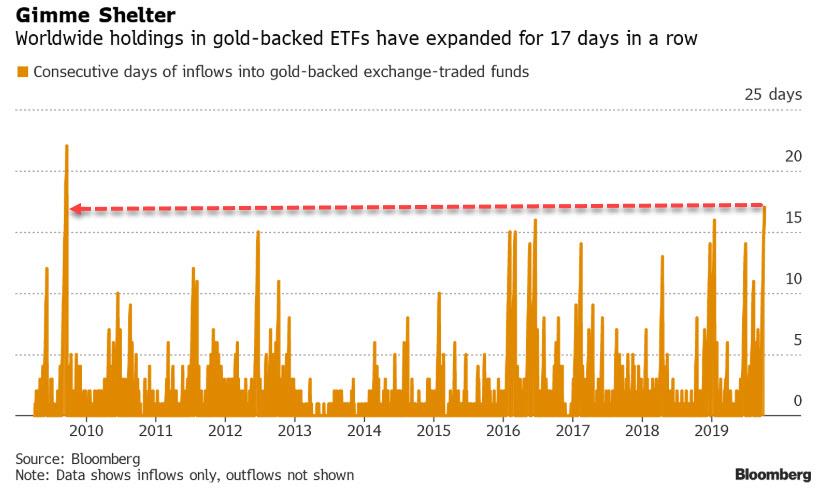
While some investors still naively hold on to the belief that the consistently manipulated (by both institutions and central banks) VIX index is a measure of overall turmoil sentiment in the market, others are rushing to the safest of assets and as global tensions escalate and signs of a global recession mount, more investors are turning to gold. According to Bloomberg, investor holdings in bullion-backed exchange-traded funds have expanded for 17 days in a row, the longest run of inflows since the global financial crisis.
Having panned gold for years, Wall Street sentiment has turned decidedly positive in recent months:
“Gold inflows are likely to persist,” said Citigroup which expects the price of gold to rally to $1,700 an ounce over the next year. “Markedly weak manufacturing and services ISM data show that the slowdown in global trade is starting to bite the U.S. economy.”
“Gold obviously stands to benefit” if China and the U.S. can’t reach a mini deal this week, said Adarsh Sinha, co-head of Asia FX and rates strategy at Bank of America Merrill Lynch.
With opinions turned decisively in gold’s favor, it is no surprise that in September, global gold-backed ETFs and similar products had US$3.9bn of net inflows across all regions, increasing their collective gold holdings by 75.2t to 2,808 tonnes(t), the highest levels of all time. According to the World Gold Council, ETF holdings surpassed late 2012 levels, at which time the gold price was near US$1,700/oz, 18% higher than current levels. Notably, the gold-backed ETF landscape is vastly different than in 2012 when two-thirds of global holdings were concentrated in North America. Today, North American- and European-listed funds make up 52% and 44% of global holdings respectively, with the remainder coming from funds listed in Asia and other regions.

Below we summarize some of the key notable long-term trends observed by the WGC in gold-backed ETFs:
- Global gold-backed ETFs added 368t (US$17.9bn, 13.4%) YTD, driven by strong inflows in the past four months
- European funds have grown consistently this year, seeing positive flows in all months except April and UK-based fund holdings are at all-time highs, reaching 582 or 21% of global gold-backed ETF assets in September
- Strong inflows in North American-listed funds over the past five months have increased the region’s contribution to 2019 growth – as of end September, North America had added 214t compared to 146t in Europe, or 58% of net inflows in 2019
- Low-cost gold-backed ETFs‡ in the US have seen positive flows for 15 of the past 16 months and have increased their collective holdings by 51% so far this year
- Asian-listed funds have reversed strong early-year outflows of over 12% and now have grown 8% on the year.
Some more details: North American funds led September’s global flows, adding 62.1t ($3.1bn, 4.5% of AUM), or 83% of net inflows. Low-cost gold-backed ETFs continued to grow, accumulating 2.9t during the month and bringing their collective holdings to 61t, worth $2.9bn. European-listed funds brought in 7.7t ($586mn, 1.0%), mainly in the UK, as investors positioned for an impeding 31 October Brexit decision. Funds in Asia had another month of strong inflows at 3.9t ($187mn, 4.6%), driven by Chinese funds.
The gold-price rally paused as global rates increased and the US dollar strengthened, falling by 3% (in US dollars) in September after having increased by 20% during the previous four months. Yet global demand for gold-backed ETFs remained strong, especially since gold remained near all-time highs in every major G10 currency, except the US dollar and Swiss franc.
Positive sentiment towards gold was also reflected in COMEX net longs, which reached all-time highs equivalent to 1,134t during the month. The volatility skew in the options market was at an all-time high, measured against available data from 2007 onwards. The skew, computed as the difference in premia paid between puts and calls at equivalent strikes, implies that market participants were willing to pay a significant premium for exposure to a higher gold price versus protection against a lower price, suggesting bullish sentiment.
Confirming the bullish tone, global trading volumes remained high across markets, finishing the month at US$183bn a day, but fell 10% from August levels. Meanwhile, volumes on the Shanghai Futures Exchange (SFE) remained elevated, at US$20bn a day, well above the 2019 y-t-d average of US$9bn and the full year 2018 average of US$3bn.
At the end of the day, however, it is all about what central banks do: global monetary policy continued to influence gold price performance as many central banks around the world cut rates or expanded quantitative easing measures. The Fed cut rates by 25bps in September – a move that was widely expected – with odds of more cuts surging after some decidedly weak economic data at the start of October.
Finally, for investors on the fence, the WGC lists several potential positive catalysts for gold in October: First, global uncertainty continues. The US House of Representatives initiated a preliminary inquiry as to whether to proceed with a formal impeachment investigation of President Trump; a move that could negatively impact risky assets and drive China to potentially delay trade solutions until the 2020 Presidential election. In addition, the deadline for a Brexit decision falls at the end of October, and there is still uncertainty as to whether there will be a ‘No Deal Brexit’ or a deadline extension. Second, despite the increases during September, interest rates worldwide remain low; we estimate that over 80% of sovereign debt is trading with negative real rates, lowering the opportunity cost of investing in gold. Finally, the US stock market is trading near all-time highs and, historically, October is a month when some of the sharpest historical down-moves in stock performance are seen; the most recent of which was last year when the S&P 500 fell 7% during the month. On the flip side, continued dollar strength and a deceleration in gold consumer demand in India and China could create headwinds.
Tyler Durden
Wed, 10/09/2019 – 19:25
![]()
Zero Hedge’s mission is to widen the scope of financial, economic and political information available to the professional investing public, to skeptically examine and, where necessary, attack the flaccid institution that financial journalism has become, to liberate oppressed knowledge, to provide analysis uninhibited by political constraint and to facilitate information’s unending quest for freedom. Visit https://www.zerohedge.com