Why The Measure Of “Savings” Is Entirely Wrong
Authored by Lance Roberts via RealInvestmentAdvice.com,
In our recent series on capitalism (Read Here), we were discussing how the implementation of socialism, by its very nature, requires an ability to run unlimited deficits. In that discussion was the following quote:
“Deficits are self-financing, deficits push rates down, deficits raise private savings.” – Stephanie Kelton

On the surface, there does seem to be a correlation between surging deficits and increases in private savings, as long as you ignore the long-term trend, or the reality of 80% of Americans in the U.S. today that live paycheck-to-paycheck.
The reality is the measure of “personal savings,” as calculated by the Bureau of Economic Analysis, is grossly inaccurate. However, to know why such is the case, we need to understand how the savings rate is calculated. The website HowMuch.com recently provided that calculation of us.

As you can see, after the estimated taxes and estimated expenses are paid, there is $6,017 dollars left over for “savings,” or, as the Government figures suggest, an 8%+ savings rate.
The are multiple problems with the calculation.
-
It assumes that everyone in the U.S. lives on the budget outlined above
-
It also assumes the cost of housing, healthcare, food, utilities, etc. is standardized across the country.
-
That everyone spends the same percentage and buys the same items as everyone else.
The cost of living between California and Texas is quite substantial. While the median family income of $78,635 may raise a family of four in Houston, it is probably going to be quite tough in San Francisco.
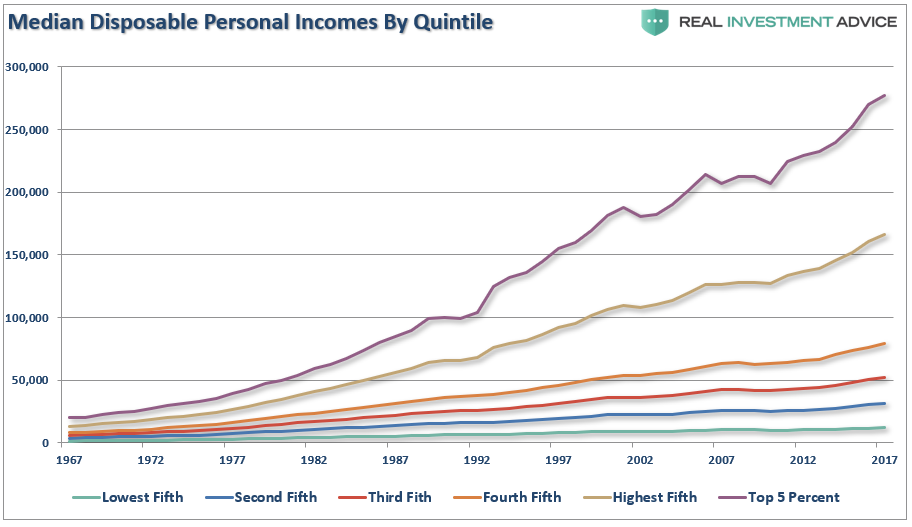
While those flaws are apparent, the biggest issue is the saving rate is heavily skewed by the top 20% of income earners. This is the same problem that also plagues disposable personal income and debt ratios, as previously discussed in “America’s Debt Burden Will Fuel The Next Crisis.” To wit:
“The calculation of disposable personal income (which is income less taxes) is largely a guess, and very inaccurate, due to the variability of income taxes paid by households. More importantly, the measure is heavily skewed by the top 20% of income earners, and even more so by the top 5%. As shown in the chart below, those in the top 20% have seen substantially larger median wage growth versus the bottom 80%. (Note: all data used below is from the Census Bureau and the IRS.)”
The interactive graphic below from MagnifyMoney shows the disparity of income versus savings even more clearly.
When you look at the data in this fashion, you can certainly begin to understand the calls for “socialism” by political candidates. The reality is the majority of Americans are struggling just to make ends meet, which has been shown in a multitude of studies.
“The [2019] survey found that 58 percent of respondents had less than $1,000 saved.” – Gobankingrates.com
Or, as noted by the WSJ:
“The American middle class is falling deeper into debt to maintain a middle-class lifestyle.
Cars, college, houses, and medical care have become steadily more costly, but incomes have been largely stagnant for two decades, despite a recent uptick. Filling the gap between earning and spending is an explosion of finance into nearly every corner of the consumer economy.
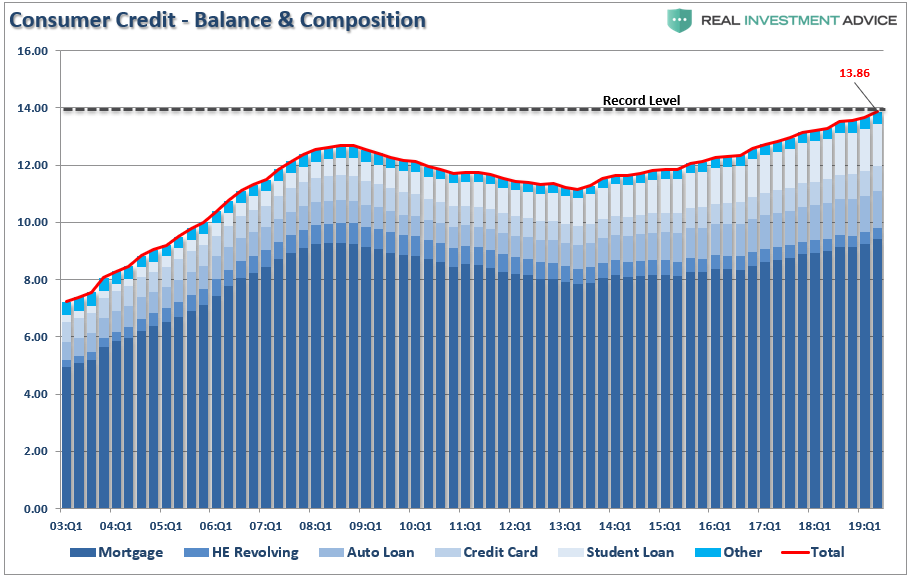
Consumer debt, not counting mortgages, has climbed to $4 trillion—higher than it has ever been even after adjusting for inflation.”
When looking at the data, it is hard to suggest that Americans are saving 8% or more of their income.
The differential between incomes and the actual “cost of living” is quite substantial. As Researchers at Purdue University found in their study of data culled from across the globe, in the U.S., $132,000 was found to be the optimal income for “feeling” happy for raising a family of four. (I can attest to this personally as a father of a family of six)
A Gallup survey found it required $58,000 to support a family of four in the U.S. (Forget about being happy, we are talking about “just getting by.”)
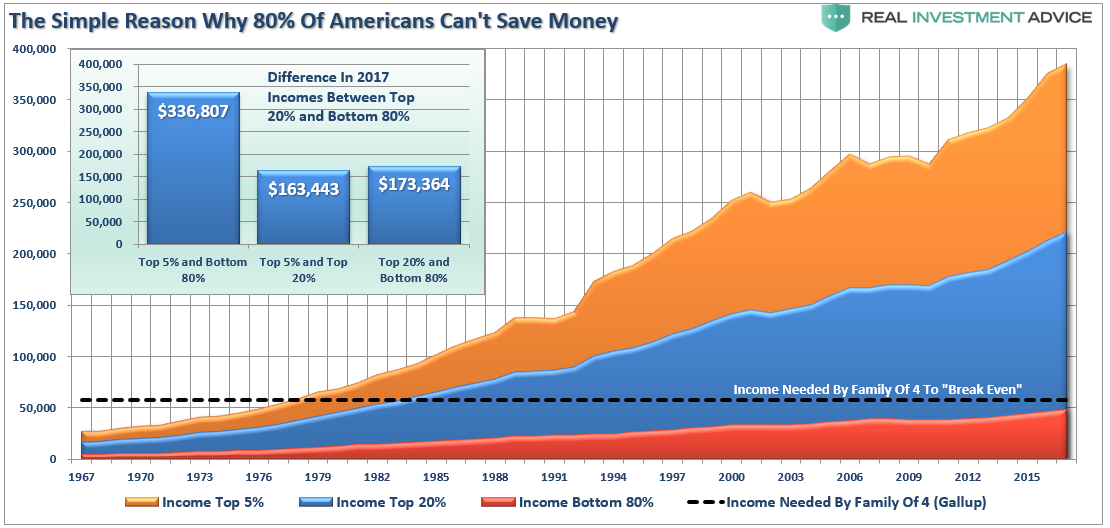
So, while the Government numbers suggest the average American is saving 8% of their income annually, the majority of “savings” is coming from the differential in incomes between the top 20% and the bottom 80%.
In other words, if you are in the “Top 20%” of income earners, congratulations, you are probably saving a chunk of money.
If not, it is likely a very different story.
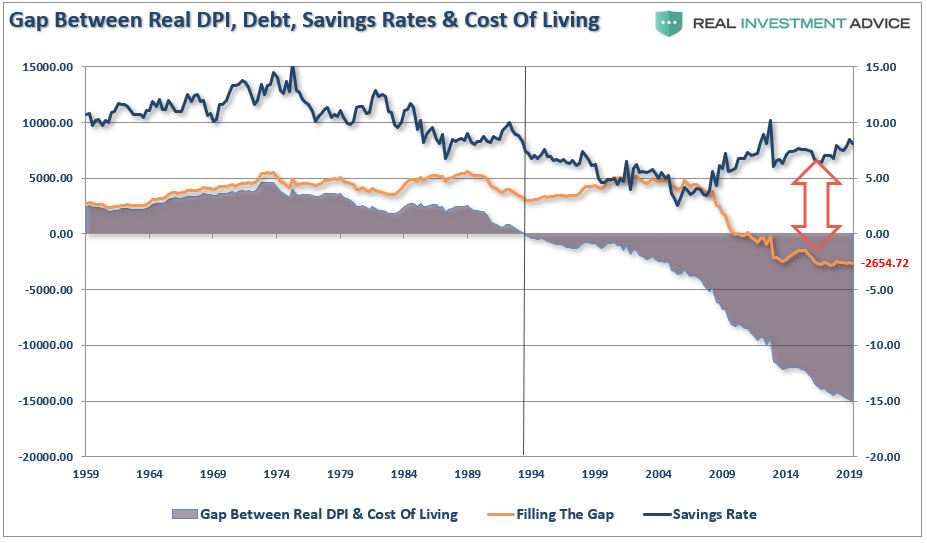
The “gap” between the “standard of living” and real disposable incomes is shown below. Beginning in 1990, incomes alone were no longer able to meet the standard of living so consumers turned to debt to fill the “gap.” However, following the “financial crisis,” even the combined levels of income and debt no longer fill the gap. Currently, there is almost a $2654 annual deficit that cannot be filled.
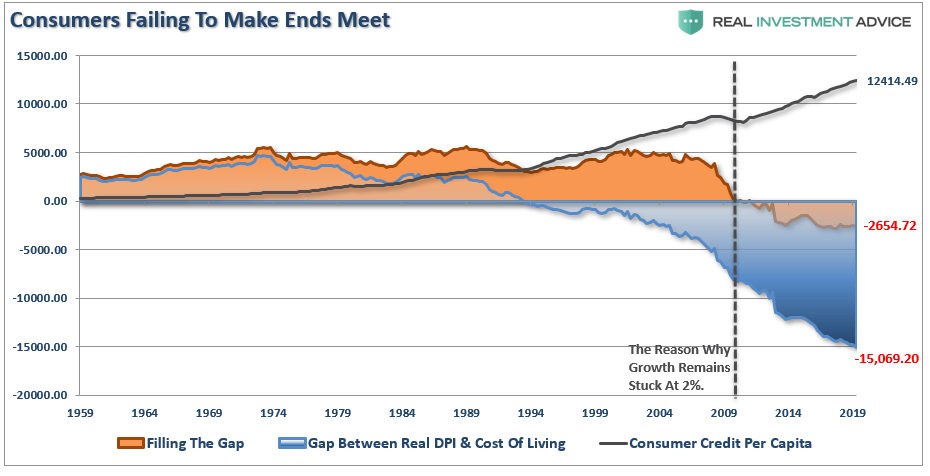
That gap explains why consumer debt is at historic highs and growing each year. If individuals were saving 8% of their money every year, debt balances would at least be flat, if not declining, as they are paid off.
We can see the inconsistency between the “saving rate” and the requirement to sustain the “cost of living” by comparing the two. Beginning in 2009, it required the entire income of wage earners plus debt just to maintain the standard of living. The gap between the reported savings rate, and reality, is quite telling.
While Stephanie Kelton suggests that running massive deficits increases saving rates, and pose not economic threat as long as their is no inflation, the data clearly suggests this isn’t the case.
Savings rates didn’t fall in the ’80s and ’90s because consumers decided to just spend more. If that was the case, then economic growth rates would have been rising on a year-over-year basis. The reality, is that beginning in the 1980’s, as the economy shifted from a manufacturing to service-based economy, productivity surged which put downward pressure on wage and economic growth rates. Consumers were forced to lever up their household balance sheet to support their standard of living. In turn, higher levels of debt-service ate into their savings rate.
The problem today is not that people are not “saving more money,” they are just spending less as weak wage growth, an inability to access additional leverage, and a need to maintain debt service restricts spending.
That is unless you are in the top 20% of income earners.
Tyler Durden
Thu, 10/17/2019 – 12:15
![]()
Zero Hedge’s mission is to widen the scope of financial, economic and political information available to the professional investing public, to skeptically examine and, where necessary, attack the flaccid institution that financial journalism has become, to liberate oppressed knowledge, to provide analysis uninhibited by political constraint and to facilitate information’s unending quest for freedom. Visit https://www.zerohedge.com