
Too Fast, Too Furious – Hedging For A Short-Term Correction
Authored by Lance Roberts via RealInvestmentAdvice.com,
The “QE, Not QE” Rally Is On
Last week, we discussed the “QE, Not QE” rally:
“Just recently, we released a study for our RIAPro Subscribers (30-Day Free Trial) on historical QE programs and what sectors, markets, and commodities perform best. (If you subscribe for a 30-day Free Trial you can read the entire report ‘An Investor’s Guide To QE-4.’)”
‘On October 9, 2019, the Federal Reserve announced a resumption of quantitative easing (QE). Fed Chairman Jerome Powell went to great lengths to make sure he characterized the new operation as something different than QE. Like QE 1, 2, and 3, this new action involves a series of large asset purchases of Treasury securities conducted by the Fed. The action is designed to pump liquidity and reserves into the banking system.
Regardless of the nomenclature, what matters to investors is whether this new action will have an effect on asset prices similar to prior rounds of QE. For the remainder of this article, we refer to the latest action as QE 4.’“
The following is one of the tables from the article.
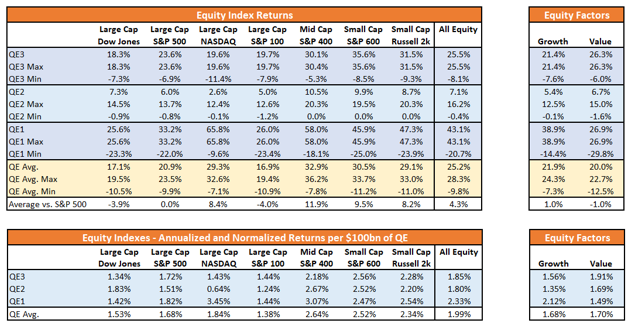
As you will notice, all major markets increased in value during QE-1, 2, and 3.
Regardless, whether you believe the Fed’s actions are “QE,” “QE-Lite,” of “Not QE at all” is largely irrelevant.
What is relevant is that each time the Fed has engaged in monetary programs, the markets have risen. Therefore, it should not be surprising investors now have a “Pavlovian” response to the Fed’s “ringing of the bell.”
During the past few weeks, we have discussed the probability of a year-end rally, which would be supported by both the Fed, and a “trade deal.” The following links will catch you up on our premise.
-
The QE Rally Is On – How To Play It & What Happens Next 11-08-19
-
Trade Deal Done? Is 3300 The Next Stop For The Market? 10-11-19
With the Fed cutting rates, Trump touting “trade deals,” and now “tax cuts for the middle class,” not to mention the Federal Reserve increasing their balance sheet, it should not surprising markets have rallied over the last 5-weeks as shown below.
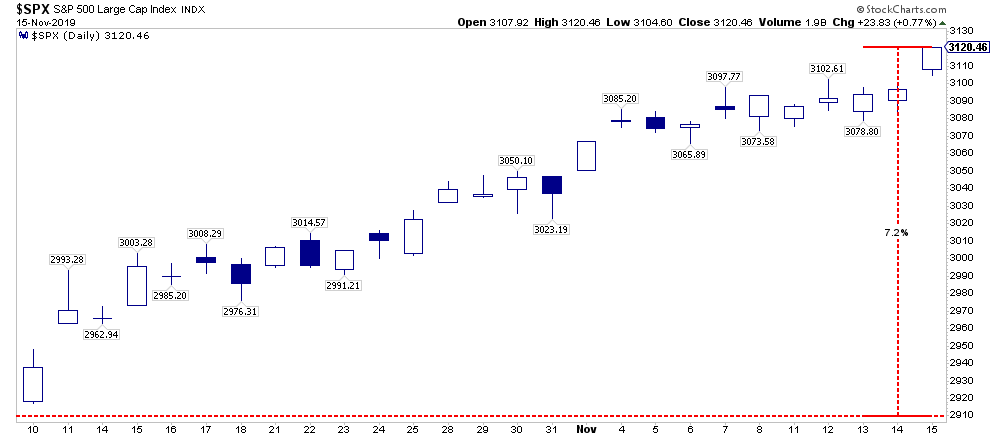
Think about it this way, in just 5-weeks the market has almost advanced as much as the long-term historical average annual return.
This should suggest two things.
-
The market has already priced in a bulk of the benefit from the additional liquidity; and,
-
The market has advanced too quickly.
Too Fast, Too Furious
On Tuesday, I posted a series of charts which showed the rather rapid reversion from more extreme bearishness mid-summer to more extreme bullishness now.
As I noted:
“But it isn’t just the more extreme advance of the market over the past 5-weeks which has us a bit concerned in the short-term, but a series of other indications which typically suggest short- to intermediate-terms corrections in the market.
Historically, when all of the indicators are suggesting the market has likely encompassed the majority of its price advance, a correction to reverse those conditions is often not far away. Regardless of the timing of that correction, it is unlikely there is much upside remaining in the current advance, and taking on additional equity exposure at these levels will likely yield a poor result.”
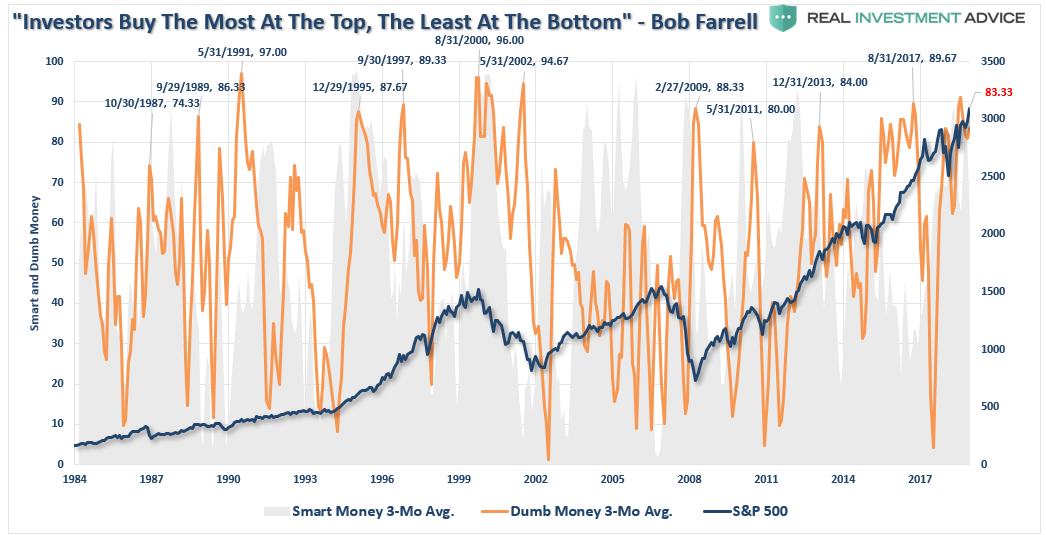
What is quite amazing is that this reversal from “bearish” to “bullish” occurred precisely as the Fed began pumping liquidity into the markets. The last time investor sentiment was this bullish was at the beginning of 2018, which eventually led to a near 20% correction.

As with above, retail investors are “all in” once again with the smart/dumb money indicator noting an extreme bullish bias of retail investors.
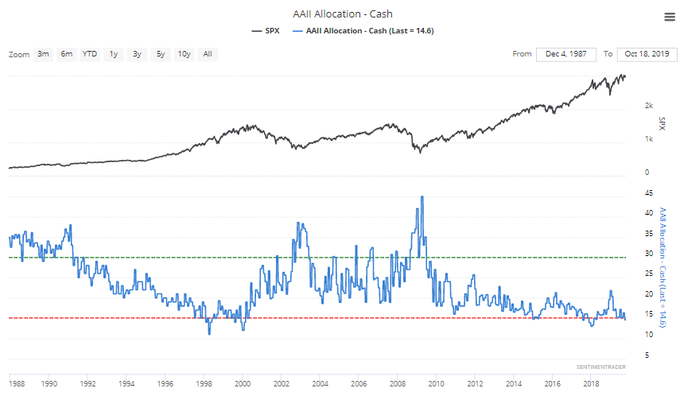
Of course, this coincides with extremely low individual cash levels of individuals.
“With cash levels at the lowest level since 1997, and equity allocations near the highest levels since 1999 and 2007, it suggests investors are now functionally ‘all in.’”
With net exposure to equity risk by individuals at historically high levels, it suggests two things:
-
There is little buying left from individuals to push markets marginally higher, and;
-
The stock/cash ratio, shown below, is at levels normally coincident with more important market peaks.
Lastly, for a “bullish sentiment” perspective, investment newsletters are now exceedingly bullish.
The chart below didn’t make today’s article on why we added a short-$SPY position to our portfolio’s yesterday. However, this is just another indicator that markets have gone to far, too quickly and we will likely see a short-term correction. #HedgesMatter pic.twitter.com/Deesp12eTO
— Lance Roberts (@LanceRoberts) November 12, 2019
https://platform.twitter.com/widgets.js
These are all “contrarian” indicators, which suggest that if everyone is “all in,” there is currently no one left to “buy.” Such conditions typically are associated with short-term market corrections.
However, even if we set aside investor sentiment and positioning for a moment, the rapid reversion is price has sent our technical composite overbought/oversold gauge back towards more extreme levels of overbought conditions.

As noted previously, virtually every measure of volatility has been suppressed as the “fear of a correction” has evaporated.
4 Reasons Why A Volatility Event Is On The Horizonhttps://t.co/YVCbxDKe8d
— SentimenTrader (@sentimentrader) November 13, 2019
https://platform.twitter.com/widgets.js
Low volatility measures are a representation of more extreme levels of investor complacency. Such complacency provides “fuel” for a reversion as investors sentiment transitions from complacency to fear.
As we noted just recently for our RIAPRO.NET subscribers, the divergence of breadth is also indicative of short-term tops in markets.
S&P Breadth Divergence #4 setting up pic.twitter.com/sAhRC1ETc3
— Not Jim Cramer (@Not_Jim_Cramer) November 14, 2019
https://platform.twitter.com/widgets.js
What all of this data suggests is that markets have risen “too fast, too furious” which raises the probability of a price correction in the short-term.
This is why we have hedged our portfolios last week.
Does that mean we are bearish and betting on the market to crash.
Not at all.
Why We Hedge
Currently, our portfolios are long-biased meaning we have more equity-risk in our allocation than fixed income and cash.
Given the market’s advance, and the data points set out above, and this past Tuesday, we have three choices in how we manage our client portfolios at this juncture:
-
Do Nothing – if the markets correct, we lose some of our gains and just have to wait for the portfolio to recover.
-
Take Profits – as we have done with extremely overvalued assets in the past, we can take profits, raise cash, and reduce our equity exposure in advance of a correction. Such actions mitigate the damage of the decline, but positions have to be repurchased, or new ones added, to resize the portfolio in the future.
-
Hedge – adding a position to the portfolio that is the “inverse” of the market. (the position goes up in value as the market declines.) This action allows us to keep our existing positions intact, and by “shorting against the portfolio” allows us to effectively reduce our equity risk (and related capital destruction) during a market correction.
Why did we choose “Option 3” at this juncture?
Option 1 – is never really a good option. Riding the market up and down, and spending time “getting back to even,” doesn’t make a whole lot of sense.
Option 2 – is something that we took advantage of twice this year already. We took profits at the peak of the market in May and July before both of the subsequent swoons. We also added new exposures in early October. So, taking profits again in some positions would lead to a gross underweight in certain areas of the portfolio allocation.
This makes Option 3 the most optimal at this stage of the rally.
With the Fed engaged in pumping liquidity into the markets, and any day may also include a random market manipulation from a “Trump tweet,” the most opportunistic method to hedge risk is to add a “short S&P 500” index position to the portfolio. The chart below shows the range of options which we expect could occur.
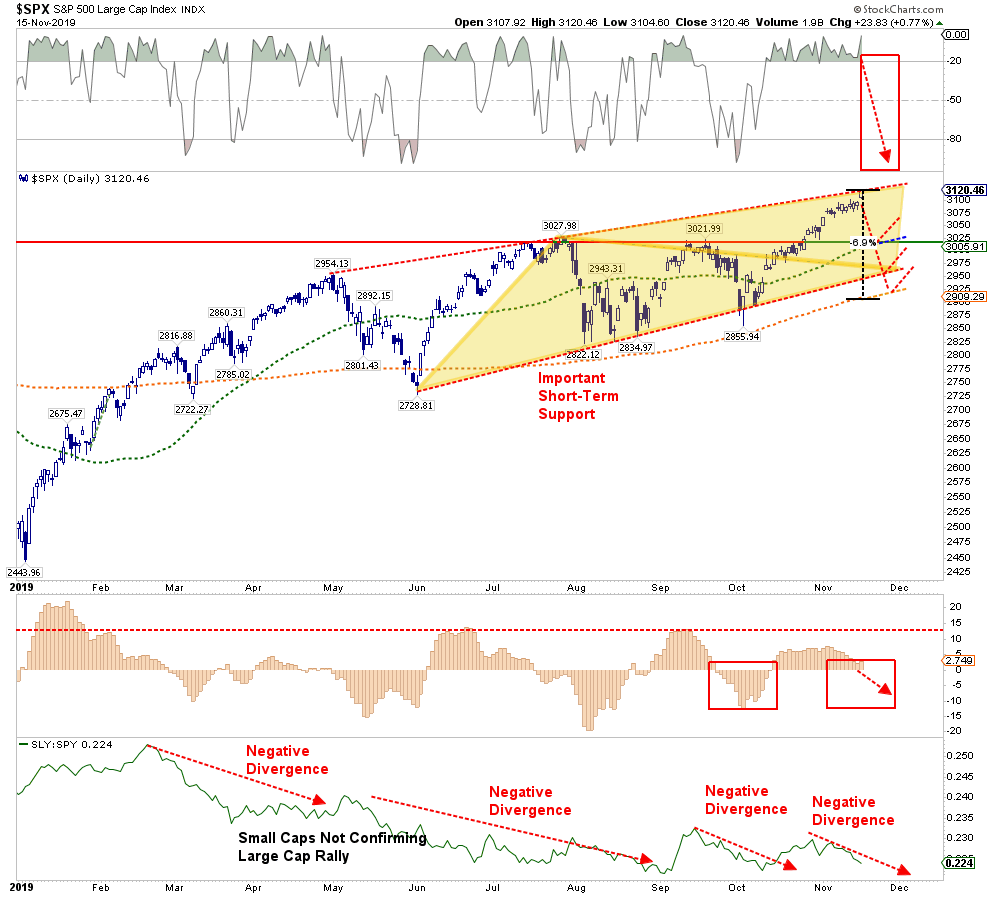
-
Market breaks ABOVE the current upward trending range. We are currently carrying a stop at 3150 for our short position, where we will close it out. Yes, we will have a minimal loss in the position but the rest of our equity holdings will advance more than making up for the differential. (Example: On Friday, the S&P 500 increased .77%, our 60/40 Equity Portfolio with the Short Position rose by .46%)
-
Market corrects to the currently rising 50-dma and in that process reverses the current overbought condition of the market (top panel, red box) back to oversold. Note: the 50-dma also currently coincides with the previous resistance of this year’s market highs. A retest of this level that holds, and removes the overbought condition as noted, would be very bullish. We will close out the hedge and increase our long-exposure.
-
If the market breaks below the 50-dma, and is NOT oversold, the next level of support is the lower rising trendline. This is also important support, and a successful test that reverses the overbought condition would require a removal of hedges.
-
The last support is the rising 200-dma. If the market test and holds the 200-dma, is oversold, and sentiment has returned to a more bearish position, we will close out our hedges.
-
IF the market breaks below the 200-dma, we will likely be discussing the process of reducing long positions and increasing short-hedges.
Importantly, the range of corrections discussed only runs 3-6%, which is well within the normal confines of a bullish correction.
When we discuss hedging against risk, it is invariably taken that we have sold everything and are now betting on a market “crash.”
Such is hardly the case. We are simply taking prudent actions in the portfolio management process to reduce capital risk, and potentially add some incremental “alpha” to portfolios if a correction occurs.
This is just how we manage risk.
You have a choice to either manage risk, or ignore it.
The only problem is that ignoring risk has a long history of not working out very well.
Tyler Durden
Sun, 11/17/2019 – 13:31
![]()
Zero Hedge’s mission is to widen the scope of financial, economic and political information available to the professional investing public, to skeptically examine and, where necessary, attack the flaccid institution that financial journalism has become, to liberate oppressed knowledge, to provide analysis uninhibited by political constraint and to facilitate information’s unending quest for freedom. Visit https://www.zerohedge.com