Are Profit Margins Really Plunging? Goldman Responds To Zero Hedge
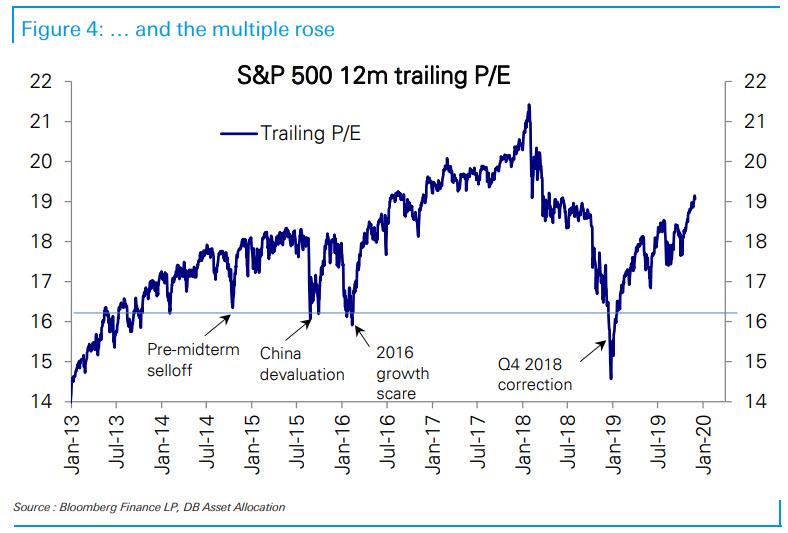
Ask any Wall Street analyst why stocks are at all time highs and the immediate answer will be because adjusted corporate profits and income are similarly at or near all time highs, which means that the multiple needed to justify an S&P around 3,150 is not all that egregious (technically it is, as DB’s Binky Chadha noted last week when he pointed out that the S&P 500 is trading at a multiple that’s higher than any time since the dot-com era, except for a few months in late 2017 and early 2018. As Chadha wrote , “the S&P 500 trailing multiple has historically mostly stayed in a range between 10x-20x. So current valuation at 19.1x is clearly at the higher end of the historical range. Indeed, over the last 85 years, outside the late 1990s equity bubble, the multiple remained below current levels around 90% of the time.”)
But is that really the case in a world where virtually everything is fake, pro-forma, non-GAAP or otherwise “adjusted” to fit a given narrative?
To answer this question, ten days ago we showed the one measure of corporate profitability that avoids various non-GAAP adjustments and one-time addbacks. We referred to the data set tracking corporate profitability without the benefits of non-GAAP adjustments, which is reported by the BEA as Corporate profits with inventory valuation (IVA) and Capital Consumption (CCAdj) adjustments. Such operating profits, or profits from current production, are the purest form of corporate earnings since this series puts all firms on the same accounting framework – it avoids non-GAAP adjustments – and the profit numbers are not adjusted for the number of shares outstanding.
And here, something stunning emerged when looking at corporate profits (after tax with IVA and CCAdj) as a % of US GDP: these have not only tumbled to the lowest level this decade, but are in fact lower than where they were when the US was sliding into the 2007-2009 financial crisis and when the US entered the 2007 recession!
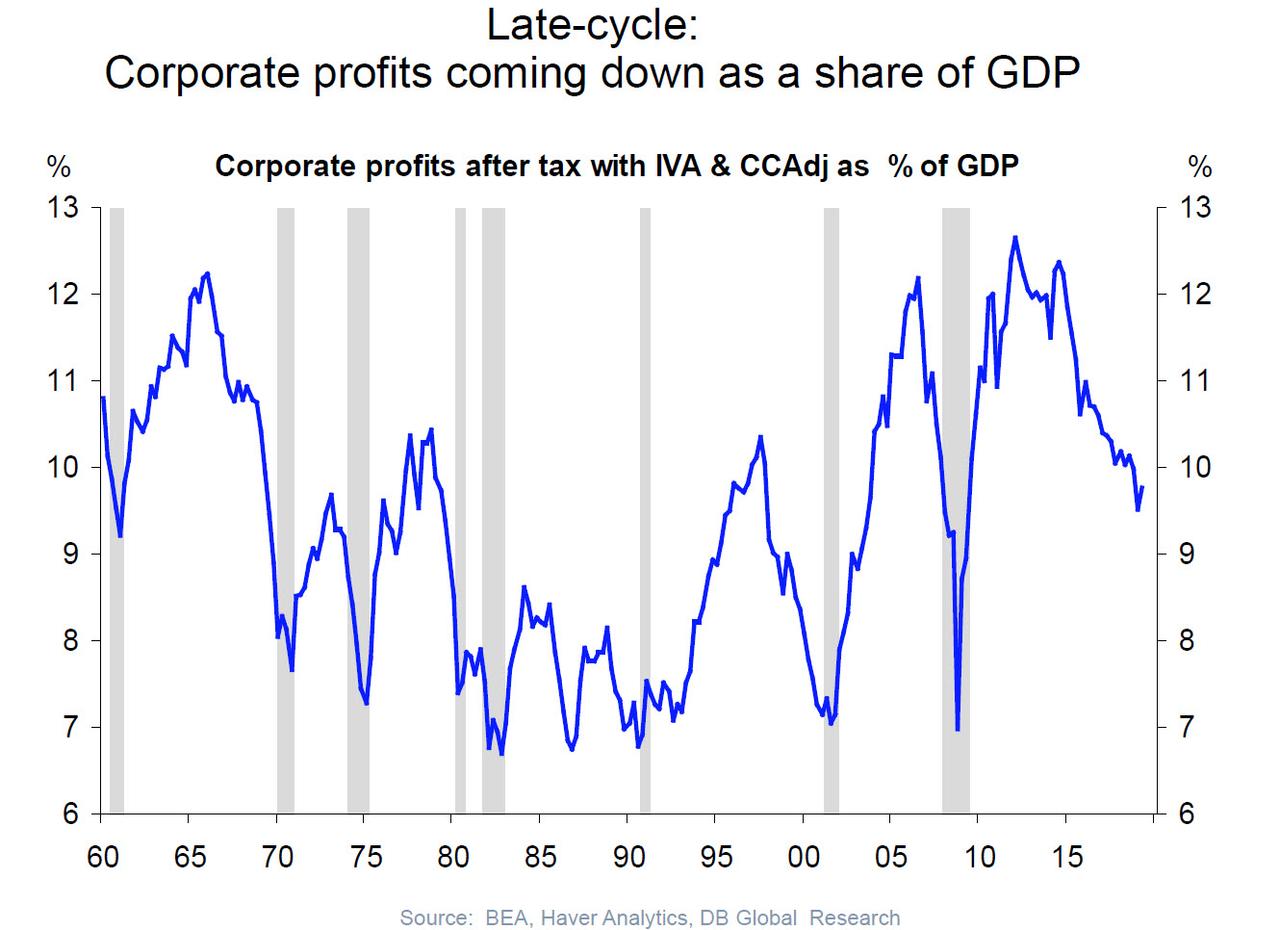
Needless to say, this is a problem because as former chief economist for Alliance Bernstein, Joseph Carson, put it in July, “the argument being used by equity analysts and strategists that the equity market is cheap or inexpensive relative to profits appears to be dubious in light of revised data on operating profits, and it suggests that the “actual ” market multiple is a lot higher than what is being reported by analysts.“
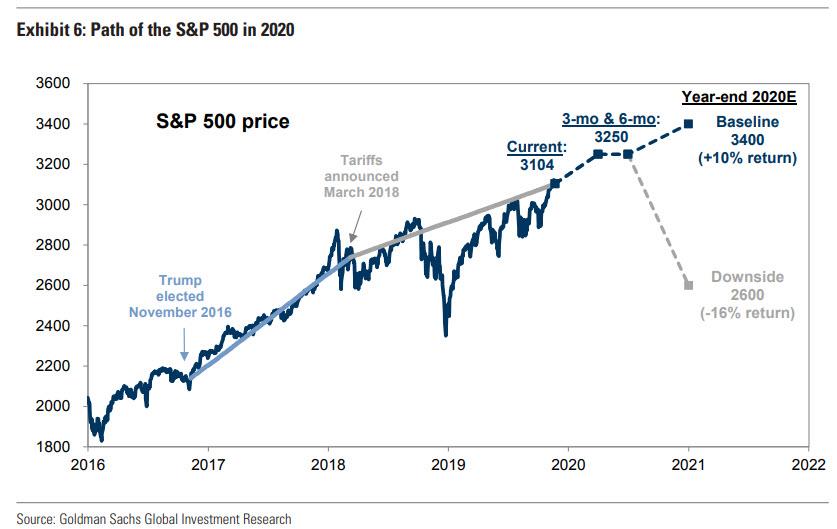
Our report appears to have struck a nerve with none other than Goldman’s clients, because in his latest closely read Weekly Kickstart report, Goldman’s chief US equity strategist, David Kostin, who as we noted previously has a 3,400 price target for the S&P in 2020 (specifically, Kostin believes that “the S&P 500 will rise to 3250 during the next three months, trade around that level for most of the year, and climb to 3400 post-election as political uncertainty abates”, unless the Democrats sweep Washington next year, in which case the S&P would tumble to 2,600 as Trump’s corporate tax generosity is unwound)…
… writes that “one common pushback to our [optimistic] forecast is that government data paint a bleak picture of corporate profitability and S&P 500 profits may “catch down.”
In other words, Goldman’s clients are hardly confident in Goldman’s profit and profit margin forecasts – which expect that S&P 500 EPS will grow by 6% in 2020 and 5% in 2021 – and instead are quite concerned by the true profit data, which we pointed out at the end of November, is plunging.
That also explains the title of Kostin’s weekly piece, namely “BEA vs. CPAs: Why the government says margins have been falling while S&P 500 firms say the opposite.”
Without directly referencing our article, Kostin writes that “a duel is taking place between the federal government, represented by the Bureau of Economic Analysis, and publicly-traded firms audited by Certified Public Accountants.”
The BEA publishes the National Income and Profit Accounts (NIPA), which shows that profit margins for US companies fell from 6% in 2012 to 5% in 2017, and rose by only 20 bp in 2018 despite the 14 pp decline in the statutory corporate tax rate. In contrast, S&P 500 margins have increased on an adjusted, operating, and GAAP basis, including growth of more than 100 bp in 2018.”
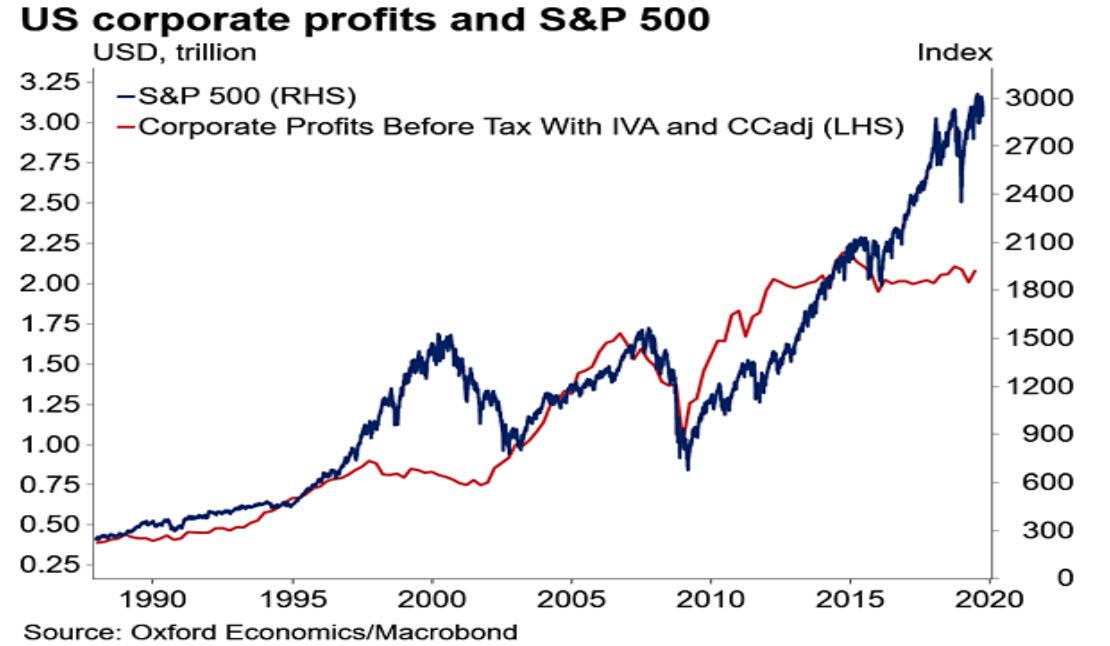
Visually this unprecedented discrepancy is shown in the chart below:
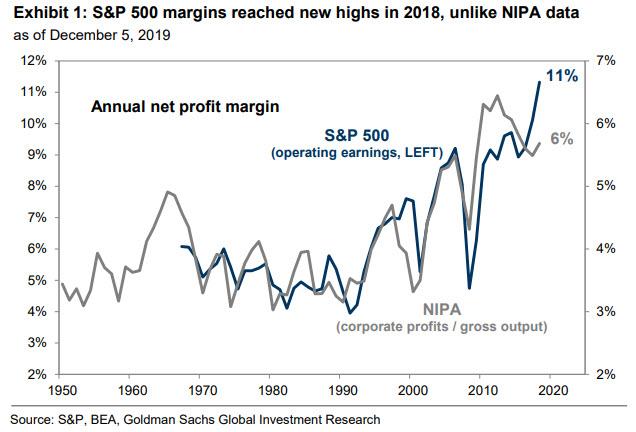
The issue is that whereas the S&P has been tracking operating earnings to all time highs and profits are just off all-time highs at 11%, corporate profits as reported by the BEA have been declining for the past 5 years, eroding any case for a fairly valued market and continued equity upside.
So going back to this “pushback” that Goldman’s clients are offering to Kostin’s rosy take (as “government data paint a bleak picture of corporate profitability and S&P 500 profits may “catch down”), which Goldman explains as “investor concerns stemming from the fact that NIPA profit margin declines have typically preceded S&P 500 margin declines, as in the lead-up to the Tech Bubble“, what is Kostin’s response? Well, obviously, since Goldman expects stocks to keep rising (and rising, and rising), the Goldman chief equity strategist believes that these fears are overdone – or in other words, Goldman claims that corporate profits are set to keep rising despite what the government says – for the following five reasons (we quote from Kostin):
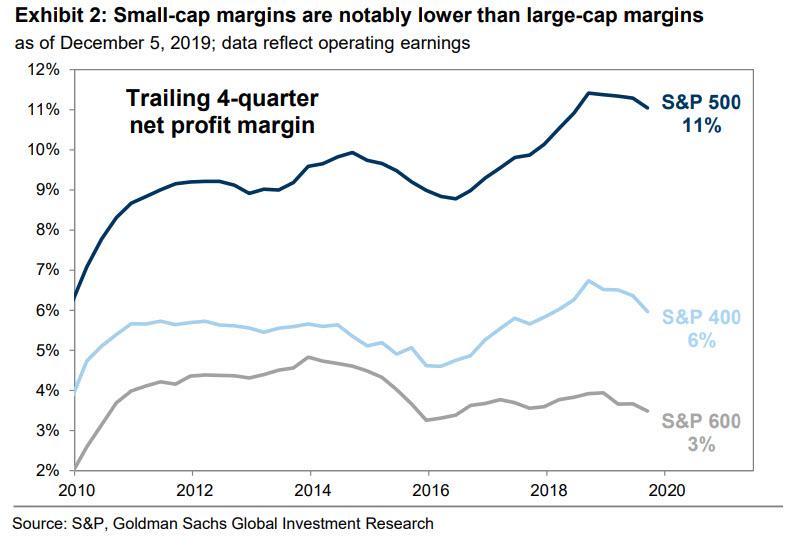
1. Size: The S&P 500 comprises large, profitable companies while NIPA data reflects all companies, large and small and public and private. Aggregate S&P 500 profits represent just 61% of total NIPA profits. As a result, the broader US economy has a far greater exposure to smaller, less profitable companies. Before even considering private companies, the net profit margin for publicly-traded small caps (S&P 600) equals 3%, compared with 11% for large caps (S&P 500). In addition, similar to NIPA data, profit margins for the S&P 600 have been declining since 2013 despite the secular rise in S&P 500 profit margins.
2. Labor: Due in part to their size and efficiency, labor costs represent a much smaller share of S&P 500 sales than of the broader US economy. We previously found that labor costs account for 12% of S&P 500 sales, while compensation as a share of gross output for the US economy equals 27%. In addition, rising concentration and the corresponding bargaining and pricing power have also helped insulate large companies from wage pressures. The share of respondents reporting rising wages in the NABE survey has been steadily climbing since 2013 and wages in the US grew by more than 3% in each of the last 14 months. However, S&P 500 profit margins remain just shy of their record high. In contrast, small companies have less flexibility to offset these margin pressures, reflected in the 130 bp decline in S&P 600 margins since 2013.
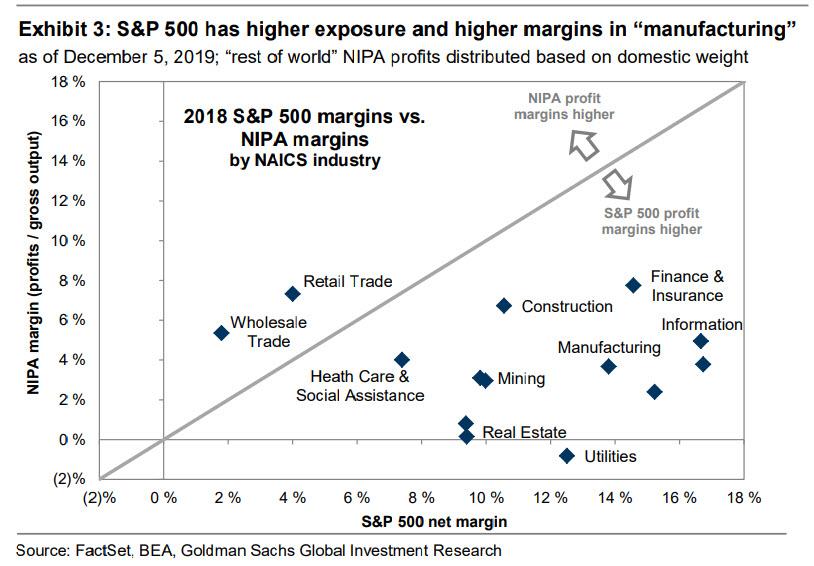
3. Sector: The continued divergence between “superstar” firms – with larger weights in the S&P 500 – and smaller firms also helps explain the margin differential with NIPA. Info Tech accounts for 23% of S&P 500 market cap and 19% of S&P 500 earnings. The sector has experienced 12 pp of margin expansion this cycle to the current level of 23% (vs. 11% for S&P 500) and has been the most significant contributor to index-level profitability. While the GICS and NAICS classifications do not match perfectly, these high-margin companies and sectors have smaller weights in NIPA data. Using each company’s NAICS code, we find that “manufacturing,” which includes many large technology and health care firms, represents 36% of S&P 500 sales (vs. 19% for NIPA) and has a 14% margin (vs. 4% for NIPA). NIPA also has a greater exposure to low-margin industries such as Real Estate.
4. Tax: Following the passage of corporate tax reform, the S&P 500 aggregate effective tax rate fell by 8 pp (from 26% to 18%). Based on NIPA data for the entire US economy, the effective tax rate fell by only 5 pp (from 16% to 11%). The S&P 500 therefore received a larger one-time earnings boost from lower tax rates. Much of the gap may be explained by compositional differences, such as greater exposure to small, unprofitable firms that do not pay taxes and the inclusion of S-corporations and nonprofits in NIPA data. Within the S&P 600, 23% of companies have income taxes less than or equal to zero during the last four quarters.
5. Accounting: Many investors question whether accounting discrepancies between S&P 500 firms and NIPA data drive the gap in profit margins. Most equity analysts consider “adjusted” earnings, looking through one-time charges that may add to quarterly earnings noise. While adjusted margins and earnings growth have certainly exceeded GAAP measures, GAAP fundamentals for the S&P 500 nonetheless appear much stronger than the signal sent by NIPA data. GAAP earnings have grown by 21% and GAAP net profit margins have expanded by 65 bp since 2013, below adjusted margin growth of 190 bp but well above NIPA margin declines.
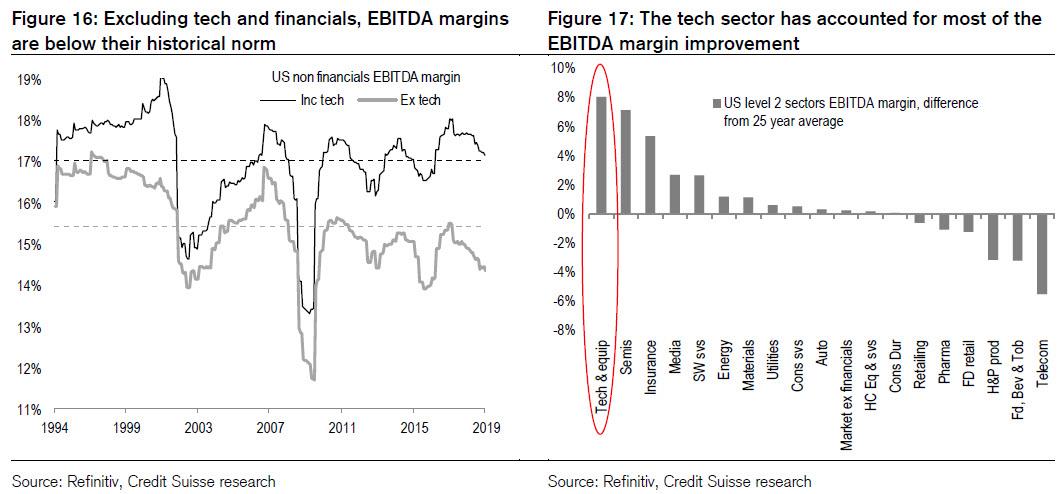
Summarizing what Kostin said, yes, adjusted non-GAAP “numbers” vs GAAP reality is a major “data massaging” issue – just as we said in our original article – but the biggest reason why there is a large and growing profit divergence has to do with how the market-cap weighted S&P accounts for “superstar” and giant tech firm profits, which are given substantially more weight than the rest of the corporate world… which incidentally is what we also noted when we said that “whereas EBITDA margins for tech companies are near or at all time highs, margins for the rest of the US corporate universe is fast approaching its financial crisis level. In other words, just the tech sector has account for all of the EBITDA margin improvement since the financial crisis!“
In other words, for all of his verbosity, all Kostin is saying is trust us, because already supermassive tech companies with record high margins will only get bigger and more supermassive, in the process drowning out the reality of collapsing profits for all other companies.
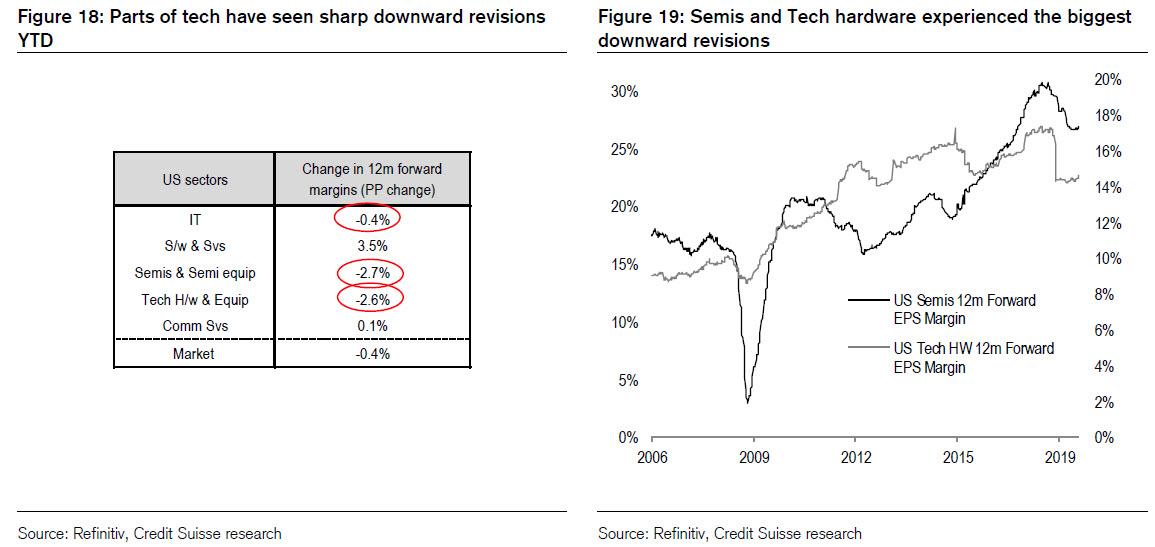
Only, that’s not true either, as Credit Suisse wrote in its 2020 year ahead outlook, margins within some tech subsectors, such as semis and tech hardware, are now rapidly sagging under trade war pressure and it’s only a matter of time before this solitary margin outlier mean reverts.
Which again brings us to what we said when we wrote the article that prompted all this pushback to Goldman’s cheerful optimism: “Whether or not tech succumbs to gravity and finally catches down with the rest of the economy – something that is virtually assured if some of the biggest tech monopolies are broken up in the coming years – is of secondary importance. What is more relevant is that if one looks at the real profits numbers, stripped of all adjustments, revisions and addbacks, a very ugly picture emerges, one where US corporate profitability is the worst since the financial crisis.“
Incidentally, it’s worth noting that despite his attempts to “explain” the unprecedented “BEA vs CPA” divergence, Kostin had nothing to counter that last, bolded sentence. Which may explain why he concludes his note with a fare more muted vision of the future, to wit:
Looking forward, we nonetheless expect only a slight S&P 500 margin expansion through 2020. S&P 500 net profit margins are on pace to fall by 65 bp in 2019, driven in large part by a 180 bp margin compression in the Energy sector and declines in a few large-cap technology stocks…. [C]ontinued wage and input cost pressures will limit margin expansion to just 13 bp in 2020 and 5 bp in 2021. If realized, S&P 500 profit margins would remain below the record high of 11.3%, set in 2018 following the passage of tax reform.”
Of course, when – not if – S&P margins collapse and catch down to NIPA when the next recession hits and slams tech companies, Kostin will simply say that nobody could have possibly foreseen what is now so obvious even to Goldman’s own clients.
Tyler Durden
Sun, 12/08/2019 – 14:25
![]()
Zero Hedge’s mission is to widen the scope of financial, economic and political information available to the professional investing public, to skeptically examine and, where necessary, attack the flaccid institution that financial journalism has become, to liberate oppressed knowledge, to provide analysis uninhibited by political constraint and to facilitate information’s unending quest for freedom. Visit https://www.zerohedge.com