BofA: QE Is Annualizing A Stunning $1.1 Trillion In The Past 4 Months
For the better part of the post-financial crisis period, central banks (and some traders desperate to represent their outperformance as due to their incredible stock picking skills, instead of the $16 trillion in central bank liquidity) have struggled to convince the world that it wasn’t their liquidity-injecting and rate-cutting actions that were the primary reason for what is now a record-breaking stock market rally. In the end they failed, and now, for better or worse, it is common knowledge – except to a handful of unemployed pseudo-academics on fintwit who still refuse to accept the glaringly obvious – that when central banks flood the market with liquidity, risk assets go up.
It’s also the reason why in his latest weekly “Flow Show” report, Michael Hartnett writes that the bullish price action – including the ongoing leadership from high yield credit and US growth stocks (SPX/SPW, US/EM, growth/value, large/small all back at 2019 highs) – is entirely due to the current “maximum liquidity, minimal growth” phase.
As Hartnett writes, the new year consensus continues to shift bullish on liquidity, as a result of what he points out is a firehose out of QE liquidity from the ECB, BOJ and, yes, Fed, with “QE annualizing a stunning $1.1 trillion in the past 4 months” even as global central banks have cut rates 80 times past 12 months, in the process “reducing concerns of recession, default, inflation in 2020.”
Regular readers are well aware of this as it was nothing but central bank liquidity as measured by the Bloomberg Global Liquidity Proxy that facilitated the unprecedented multiple expansion in global markets, as 2019 was a year when there was no earnings growth to justify the S&P’s near-record 29% return!

Which again explains Hartnett’s continued “meltup” targets in the form of the the S&P hitting 3,333 by March 3, and the 10Y yield rising to 2.20 by Feb 2:
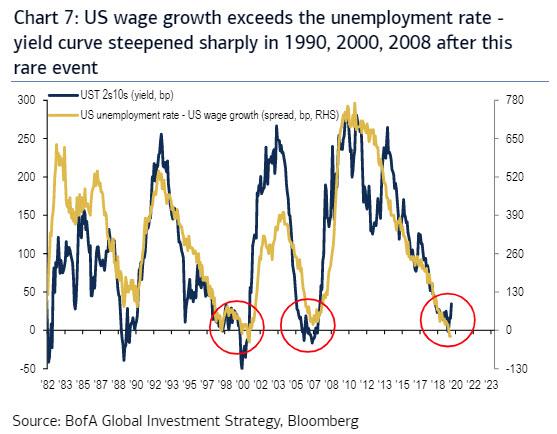
We remain Q1 bullish but note following: this week sees record inflows to bubbly bonds; credit spreads (IG AA, HY BB) cyclical lows; equity leadership stretched (AAPL >40% above 200dma), volatility not at lows, investors have priced in PMI recovery >55 but no inflation (US wage growth>unemployment rate – Chart 7).
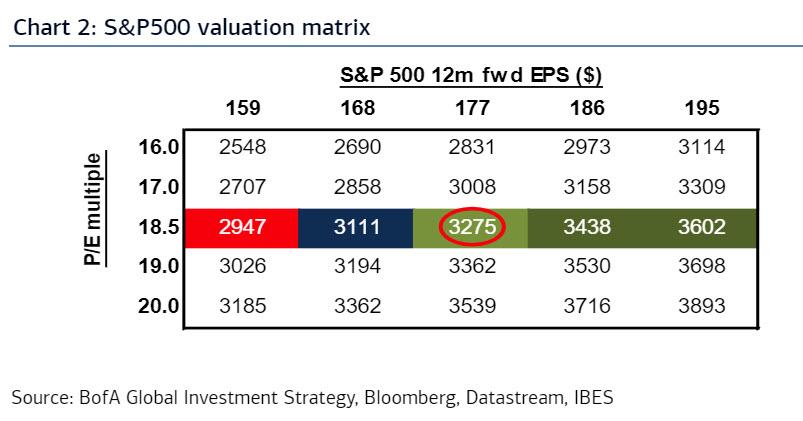
That said, even this period of unprecedented Fed generosity will end. As Hartnett concludes, “fresh gains on the back of goldilocks Dec payroll, Jan 15th trade deal, passive Jan 29th FOMC, should create peak bullishness and dovishness; we would recommend a “sell-into-strength” strategy should the 10-year yield move above 2.2% and as the SPX PE ratio approaches 20x (see Chart 2).
One final observation: while the Fed injected over $400BN in liquidity since the repo market meltdown in September, this was the first week when there were material maturities in the Fed’s repo operations, resulting in the first documented shrinkage in the Fed’s temporary and permanent liquidity injections…
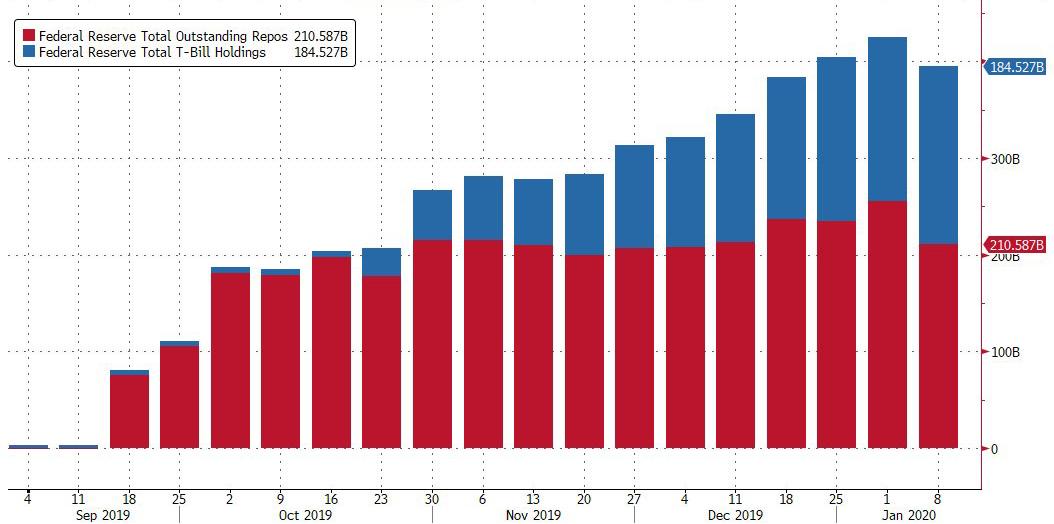
… as well as the Fed’s balance sheet…
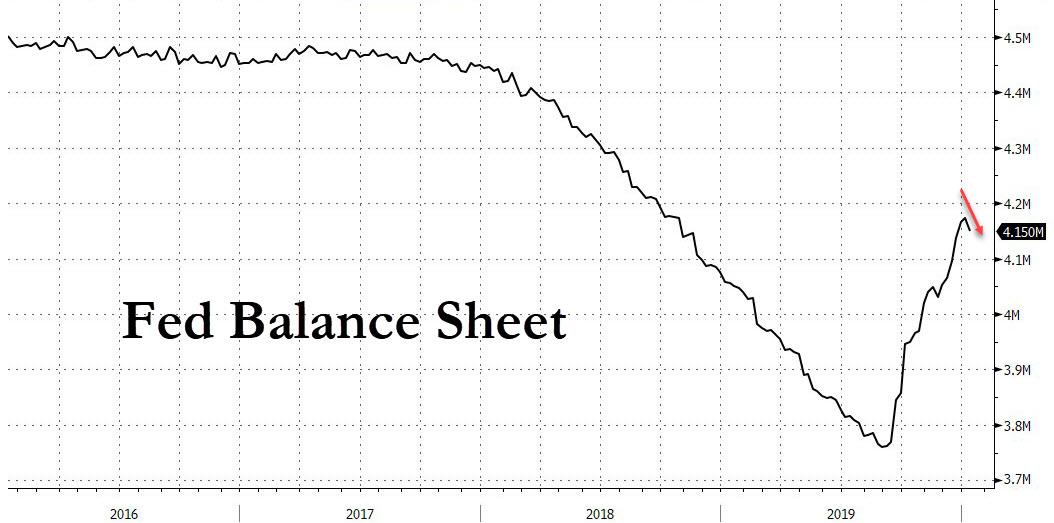
… which begs the question: have we finally hit peak liquidity for the current cycle?
Tyler Durden
Fri, 01/10/2020 – 14:45
![]()
Zero Hedge’s mission is to widen the scope of financial, economic and political information available to the professional investing public, to skeptically examine and, where necessary, attack the flaccid institution that financial journalism has become, to liberate oppressed knowledge, to provide analysis uninhibited by political constraint and to facilitate information’s unending quest for freedom. Visit https://www.zerohedge.com