Yes, It’s Possible: This Is How China Can Boost US Imports By $200 Billion
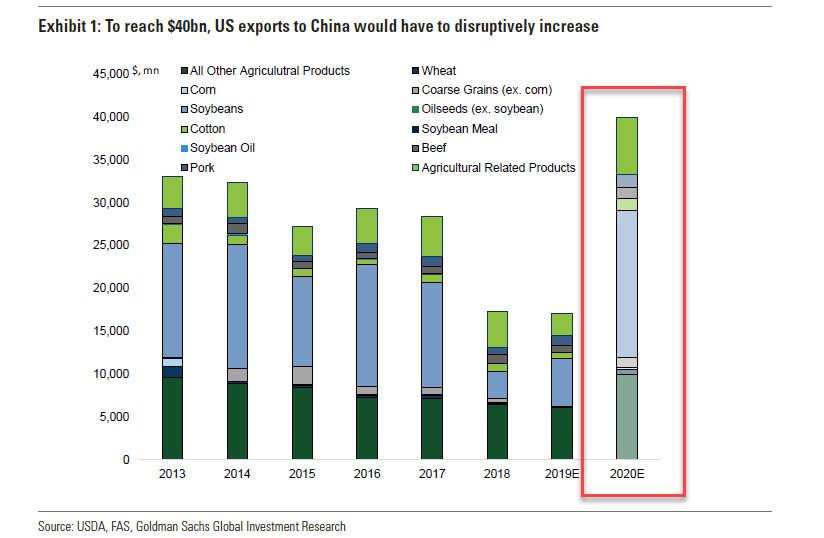
Almost one month ago we showed in one chart why the core concession in the Phase One trade deal by China – namely the promise for a “best effort” to purchase $40 billion in agricultural products from the US – appeared impossible. In short, assuming a similar export mix as in 2017, this would translate into an unprecedented 235% volumetric increase in 2020 US agricultural exports to China over 2019. The problem is that while US exports to China had declined sharply in 2018, other nations stepped in, in many cases with long-term bilateral contracts in place ensuring the long-term delivery of ag products from mostly Latin American substitute markets. This, as Goldman points out, means that such an increase in Chinese purchases from the US “would likely be hugely disruptive to global agriculture markets, primarily crowding out Argentine and Brazilian supplies that have taken substantial market share since 2017 due to the trade war and much weaker currencies.“
Fast forward to today when Reuters writes that commodity traders and analysts are similarly struggling to map out how China will reach the “eye-popping” amounts it is committing to buy from the United States under Phase 1 of their trade deal.
As we reported previously, China has pledged to buy $50 billion more in U.S. energy supplies, and will raise US agriculture purchases by some $32 billion over two years above 2017’s $24 billion baseline, according to a source briefed on the deal to be signed on Wednesday. The deal also stipulates purchases of an additional $80 billion in manufactured goods, although details still remain scarce. Overall, it was reported that, as a part of the deal, China will buy $200bn more US goods and services than 2017 cumulatively over the next two years.
Those totals would certainly trim the roughly $300 billion annual trade gap between the countries. However, analysts who study Chinese commodity flows remain skeptical that Beijing can absorb such quantities of U.S. goods without threatening trade ties with other suppliers, hurting its own domestic producers, and making substantial changes to import standards and quotas.
“Either China massively increases imports and reduces current account surplus from the current 1.5% of GDP, or it engages in trade diversion away from current providers of goods which compete with the U.S.” said Alicia Garcia Herrero, Chief Economist Asia Pacific at Natixis in Hong Kong. “I see this second scenario as much more likely.”
According to Chinese trade sources and analysts, China will have to include U.S. crude, liquefied natural gas (LNG) shipments and imports of petrochemical raw materials such as ethane and liquefied petroleum gas (LPG) to meet the target. But it would still struggle unless new supply deals are signed that displace other exporters.
The $50 billion target is “too aggressive and unlikely to achieve”, said Seng Yick Tee, an analyst at SIA Energy in Beijing, adding that energy product exports from the United States to China were about $8 billion in 2017 and 2018. “To achieve $25 billion a year, all the imports need to be tripled.”
Gavin Thompson, Vice Chair for Asia Pacific at Wood Mackenzie, was surprised by the energy figure since it would mean tariffs on U.S. crude and LNG imports would have to be removed, particularly for LNG to be competitive. Quality, rather than quantity, may be another hurdle.
“Most of the Chinese refineries were designed to process medium-sour crude, but U.S. oil is mostly light, sweet,” SIA’s Tee said, referring to the density and the sulfur amounts in crude, which dictate the types of fuels that can be refined from an oil.
But it’s China’s agricultural pledge that most found laughable: the pledge to boost U.S. farm imports by over $30 billion over two years is “shocking” since that increment is more than the value of farm products it has purchased from the U.S. in a single year, said a China-based grains trader quoted by Reuters. “It would make (more) sense if the $32 billion is the total number, not the increased number.”
Such a large fixed dollar-figure from one producer would also risk supply disruptions and distort international crop prices, said Iris Pang, Greater China economist at ING in Hong Kong. “Prices of agri (commodities) from the rest of the world could be cheaper, especially after China cut import tariffs (in January). So even after retaliatory tariffs are removed, the U.S. will not have a competitive advantage over other economies,” she said.
Traders also questioned what products China could buy from the United States since African swine fever has dented demand for soybeans for animal feed and quotas to protect domestic farmers limit grain imports. “China will, for sure, buy more soybeans, let’s say, 30 to 40 million tonnes. (For) wheat, maybe we can increase purchases within the import quota,” said a trader with a Chinese grain importer. A third grains trader said: “If such volume (of products) come to China, it will be a disaster for us (in the domestic market).”
* * *
Not everyone is a cynical skeptic, however.
Goldman Sachs has emerged as a believer that what China has promised can actually be done, and in a note published over the weekend writes that “given the size of the total Chinese imports and US exports, there should be sufficient room in theory for China to increase its purchases from the US by $200bn. However, doing so within two years would likely require policy assistance such as lower tariffs and more SOE buying under administrative measures. Commodities and commodity-like goods that are fungible and easy to substitute from one supplier to another probably will feature prominently in the list.”
A quick look at the math: Chinese policymakers have agreed to increase imports from the US by $200bn cumulatively over the next two years relative to the 2017 levels. To put this number in context, an additional $100bn per year would account for 70bp of China’s 2018 nominal GDP and would imply a doubling of China’s 2019 imports of US goods. Which is why many investors have asked Goldman (and everyone else) whether such a large amount of purchases in such a short period of time is achievable, what China is most likely to buy, and what the implications are for the economy and markets.
Annual Chinese total imports and US total exports each exceed $2tn, so increasing the bilateral trade flows by $200bn over the next two years, looks theoretically achievable. However, doing so will not be easy without policy support,due to the lack of economic competitiveness. In Exhibit 1, assuming China is going to buy an additional $200bn of US goods and services in 2020-21, Goldman constructs a potential scenario of how this may be achieved based on product fungibility and hard constraints in major markets.
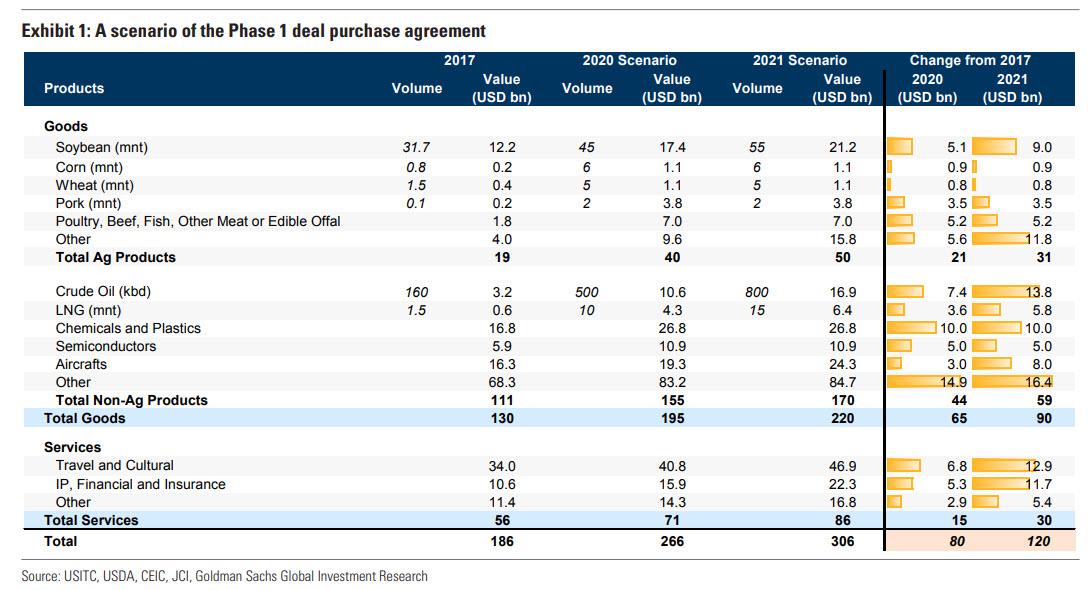
As Goldman’s analysis suggests, much of the additional purchases would result in trade diversion of commodities and commodity-like goods. However, such re-directing of trade flows, even for the most homogeneous commodities, may not happen instantaneously. Moreover, hard physical constraints such as the sharp decline in US soybean production and the grounding of Boeing’s 737MAX will likely make the purchase ramp-up especially difficult in 2020 compared to 2021.
The parameters of the deal
While not much detail is known – one day before the official signing – a few key parameters have been reported by multiple news outlets. As a part of the Phase 1 deal, China has reportedly agreed to buy $200bn more in US goods and services over two years, focusing on manufacturing, energy, agriculture and services. In particular, per the press reports, US officials have emphasized that at least $40bn of American farm products will be bought per year, and China will make “best efforts” to increase its purchases by another $5bn annually, adding up to the $40-50bn number that President Trump announced on October 11. Wheat, corn and rice are the specific agricultural products mentioned. According to the US Trade Representative Robert Lighthizer, there would be specific targets for Chinese purchases of specific products, but those would not be made public to avoid distorting markets
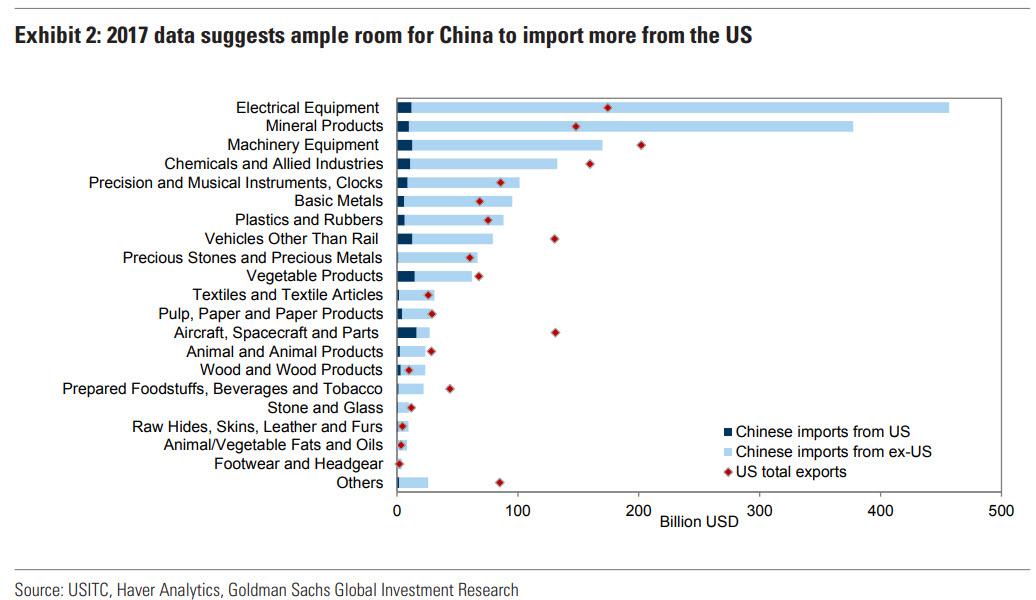
Based on aggregate numbers alone, there appears to be ample room for Chinese imports from the US to double. For example, the US exported $2.4tn goods and services in 2017 and only 8% went to China ($186bn). Similarly, China imported $2.2tn goods and services in 2017 and only 8% came from the US. Of course, there do exist notable mismatches between what China demands and what the US supplies. For example, China imports $75bn iron ore annually but the total US exports are less than $1bn per year. However, even after taking into account such supply and demand mismatches which impose physical constraints to how much China can buy from the US, the headroom seems wide enough for China to fulfill the $200bn list (Exhibit 2).
A more detailed list of what China may buy
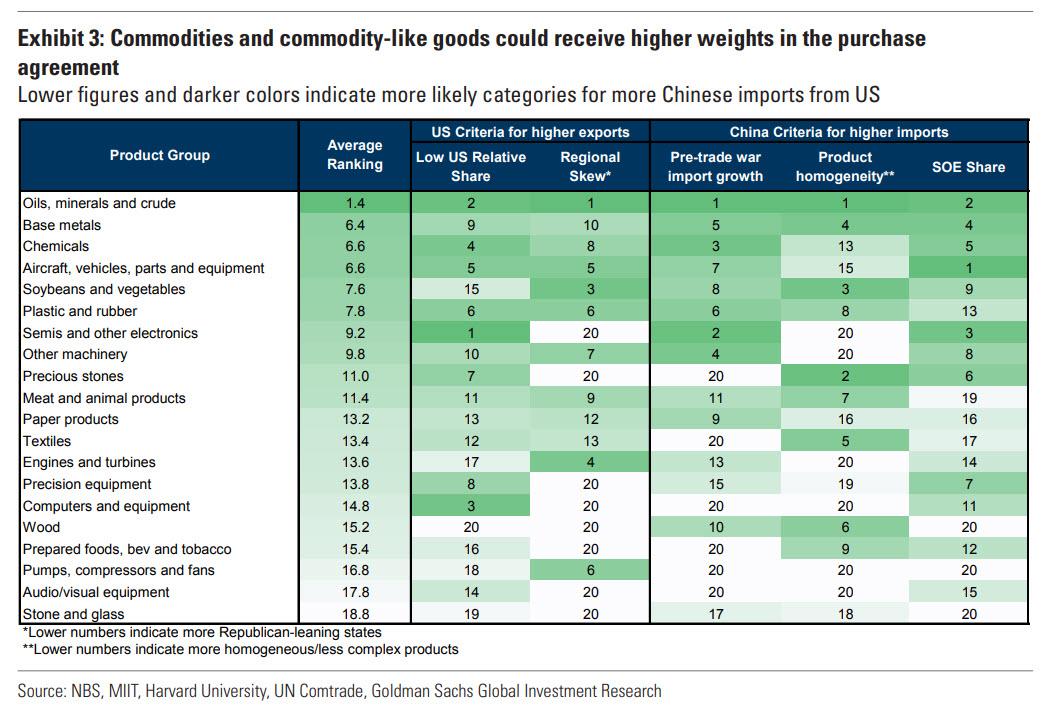
Commodities are most easily diverted in trade flows due to product homogeneity, effectively muting the impact of tariffs on the real economy. In addition to product homogeneity, we have also looked at factors such as regional skew on the US side (e.g., goods produced in Republican-/Democrat-leaning states may receive different weights in the trade deal) and SOE share on the China side (e.g., a higher SOE concentration makes it easier to implement trade policies) to assess which products could feature prominently in the purchase list. Based on an average rank across five factors, Exhibit 3 shows that commodities and commodity-like goods such as chemicals, aircraft, plastics and semiconductors stand at the top of the list.
What about Services
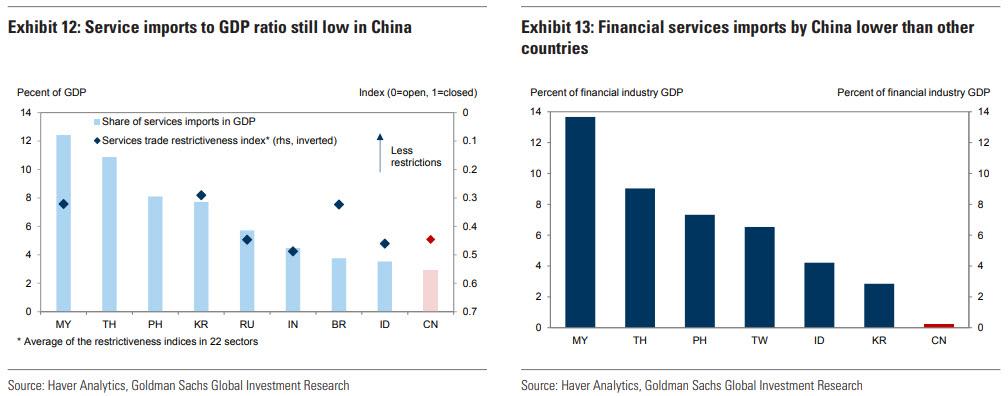
After adjusting for capital outflows disguised as travel spending in the Chinese balance of payment data, China imported $363bn in services in 2017. US data shows that service exports to China totaled $56bn in 2017, with travel services constituting the largest share (59%) followed by charges for use of intellectual property (11%), financial services (6%) and other business services (6%). Compared to other developing countries, service imports by China are still low relative to its GDP (Exhibit 12). We calculate that, if the service imports to GDP ratio in China (2.9%) were to increase to Indonesia’s level (3.5%), Chinese service imports would increase by $30bn. The OECD Services Trade Restrictiveness Index, which summarizes information on regulations affecting trade in services, shows that there is indeed room for the Chinese government to lessen service trade restrictions. Imports of financial services, for example, are significantly lower in China than in other countries when compared to the size of the country’s financial industry (Exhibit 13). More recently, discussions about financial opening have been gathering steam in China. But this is likely to be a gradual process. Overall, we think it is feasible for total Chinese imports of US services to increase $15bn in 2020 and $30bn in 2021.
If US Wins, who Loses?
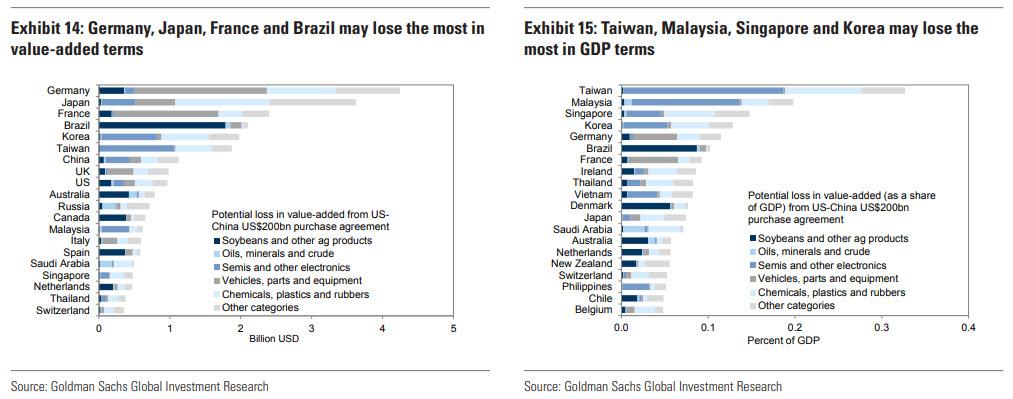
As for China’s other trading partners, Goldman applies the same methodology used in its previous research to estimate the GDP impact by combining the type of goods China may buy from the US, the likelihood and patterns of trade diversion, and the world input-output table. Exhibits 14 and 15 show that the effects would be mostly moderate, with Germany, Japan, France and Brazil estimated to experience the largest negative impact in value-added terms and Taiwan, Malaysia, Singapore and Korea in GDP terms.
Market Implications
There are two key potential market implications. First, given the unfavorable economics of raising imports from the US significantly and quickly, the Chinese government may want to keep CNY on the stronger side relative to USD to maintain its purchasing power. Second, there may be price divergence between US and ex-US prices to incentivize diversion of trade flows. Possible examples include US outperforming Brazil soybean price and WTI outperforming Brent crude oil price.
In parting, some caveats.
First, it is worth emphasizing that significant uncertainties remain on the parameters of the purchase agreement. For example, it is unclear whether multi-year contracts can be counted as a part of the $200bn package even when they do not lead to actual trade flows in 2020 and 2021. In the case of LNG, there are several large LNG projects where Chinese companies could potentially sign long-term contracts with the US. Assuming a combined volume of 50mtpa – not too aggressive an assumption based on China’s demand trajectory, the value could be $20bn per year, or $200bn for 10 years. But the actual delivery is unlikely to begin before 2023.
Second, the evaluation of GDP impact on China’s trading partners as shown above is solely based on economic factors such as similarity to the goods exported by the US and the ease of trade diversion. It leaves out political considerations which could be important in practice. For example, China’s state-run newspaper has been quoted saying that “entities from countries which are friendly to China will be favored by the Chinese people” when asked about foreign institutions who might benefit from China’s financial opening. Such political factors could affect the eventual trade outcomes above and beyond a US-China purchase agreement.
Tyler Durden
Tue, 01/14/2020 – 15:05
![]()
Zero Hedge’s mission is to widen the scope of financial, economic and political information available to the professional investing public, to skeptically examine and, where necessary, attack the flaccid institution that financial journalism has become, to liberate oppressed knowledge, to provide analysis uninhibited by political constraint and to facilitate information’s unending quest for freedom. Visit https://www.zerohedge.com